
When troubleshooting performance in a distributed environment, Datacenter Network (DCN) communication (between different host machines) and PCIe communication (between a host CPU and its local TPU device) are closely connected. Because network data from the DCN must be transferred to the TPU over the local PCIe bus, network bottlenecks often manifest as PCIe congestion or host CPU bottlenecks.
To analyze these bottlenecks holistically, you should collect performance metrics from both the device (PCIe) and host CPU (DCN/PCIe driver/OS events) perspectives.
1. Device-Side: FW PCIe Utilization Counters
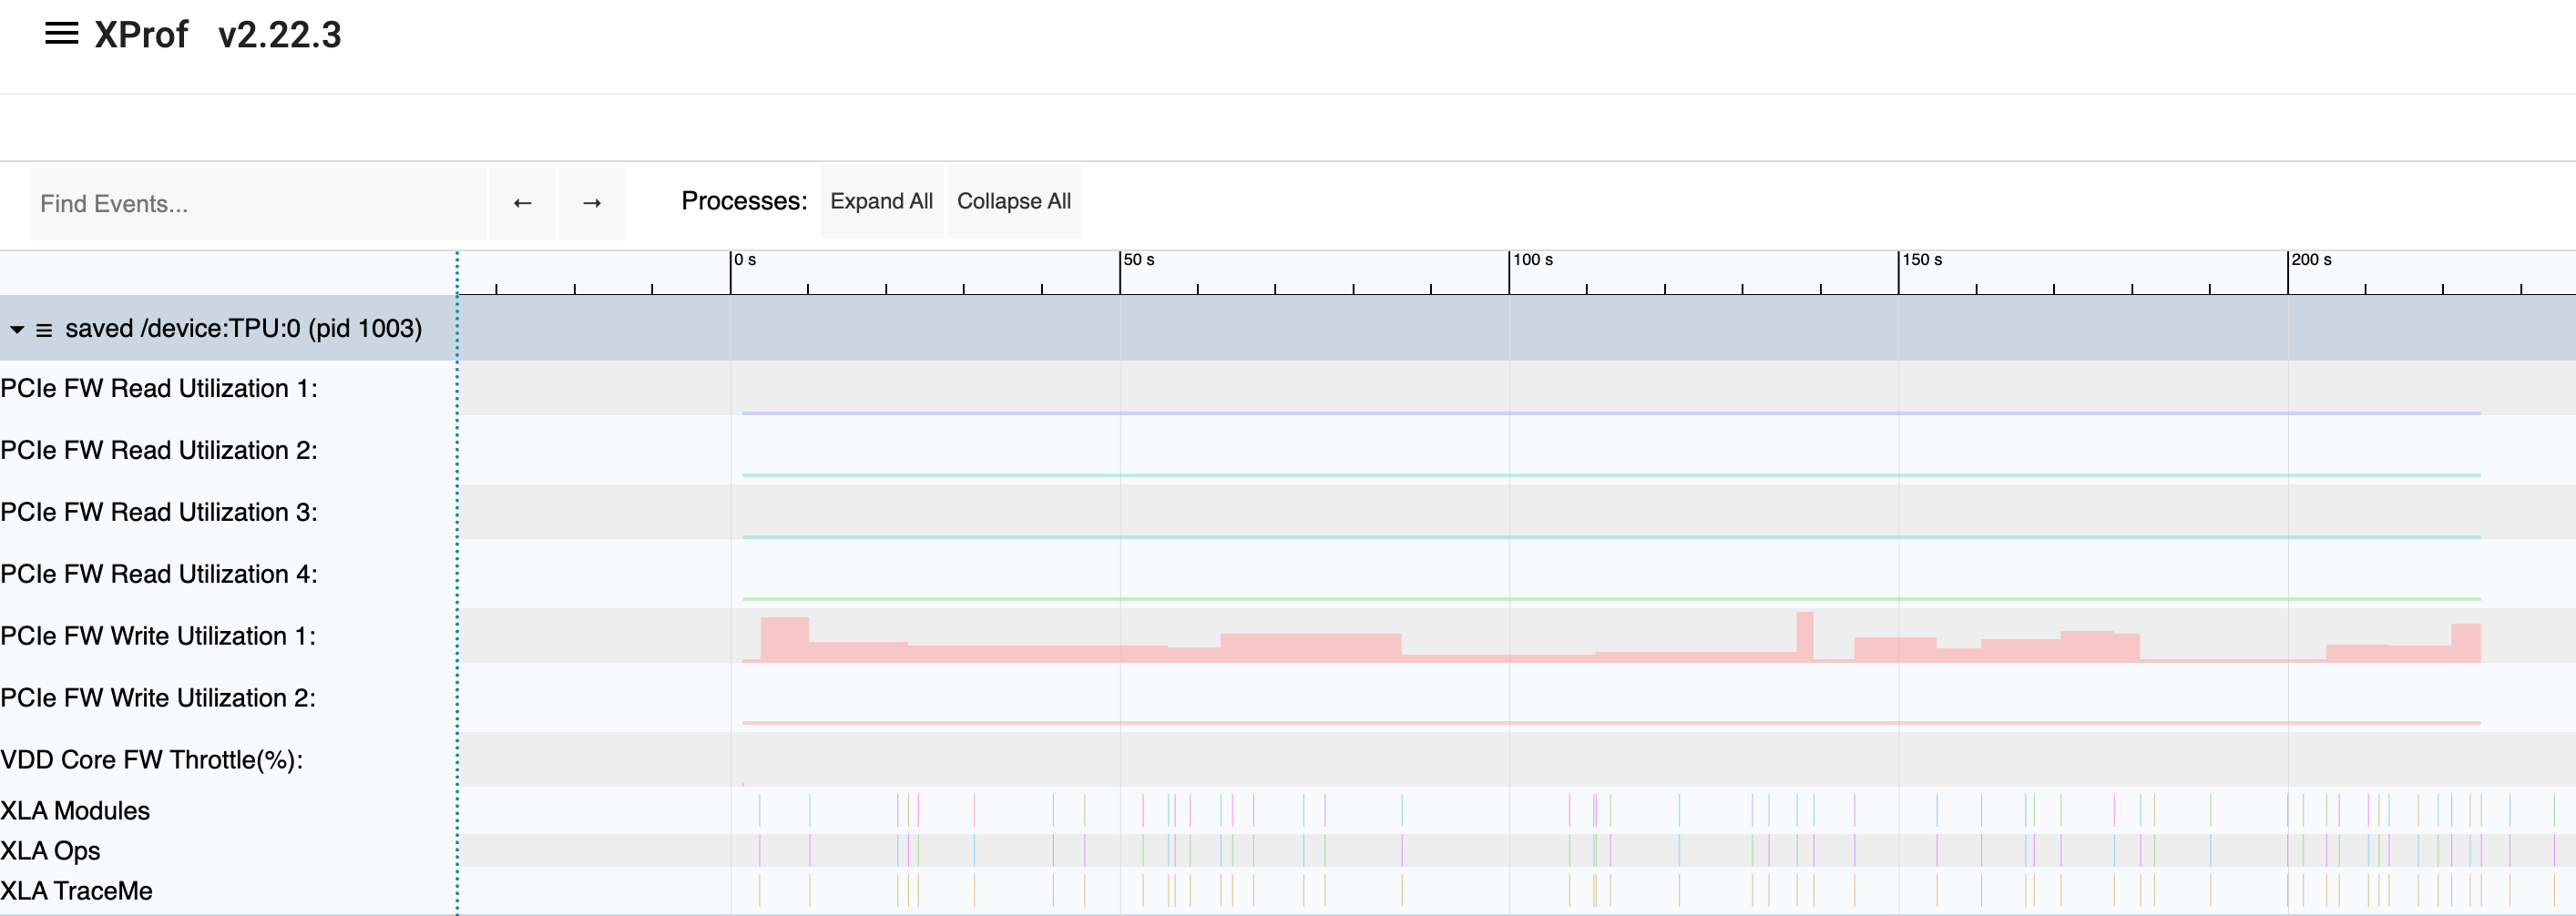
To track local host-to-device transfers from the accelerator card's perspective (available on TPU v6e and newer platforms), enable the device-side firmware PCIe counters. This measures the amount of data the TPU's firmware reports transferring over the PCIe bus.
To collect these metrics, ensure you collect the profile with the
--tpu_enable_fw_pcie_utilization_event=true flag.
2. Host-Side: Host Performance Counters
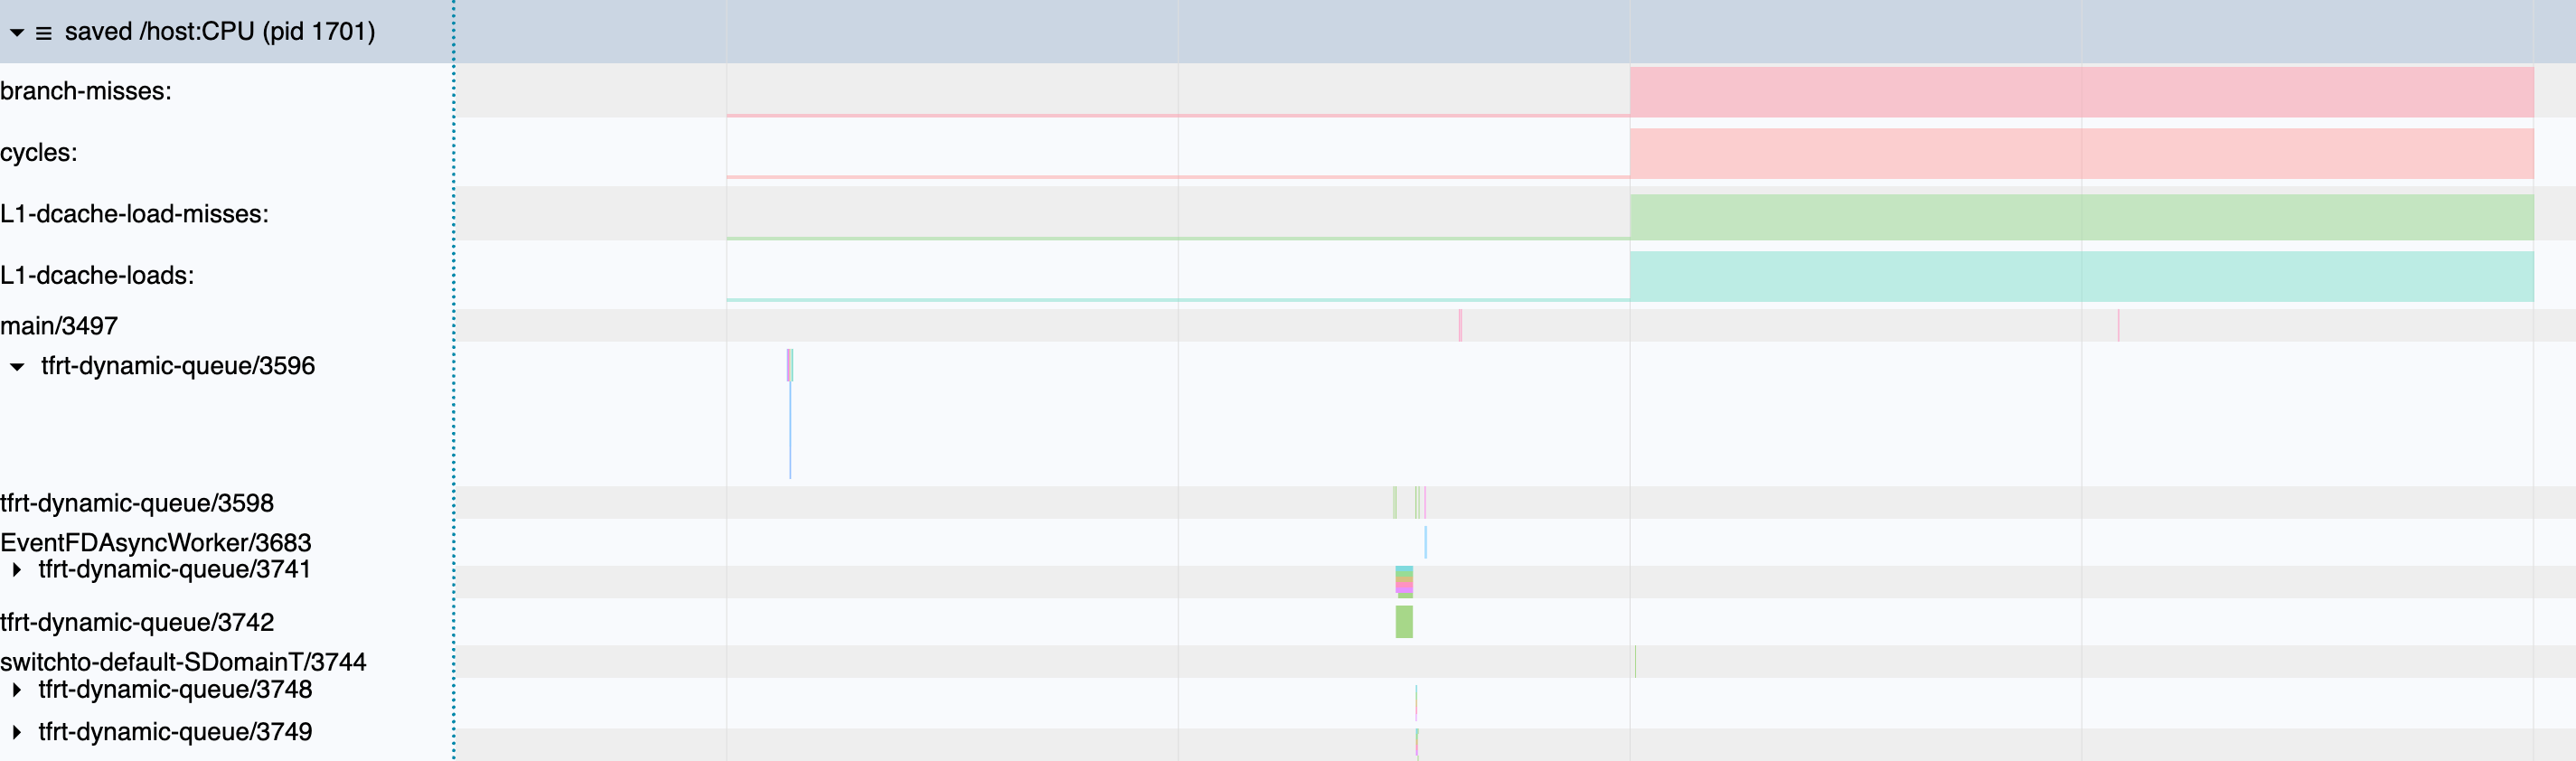
To see how the host machine is handling network and PCIe traffic, XProf can collect Host Performance Counters (e.g., host-side CPU cache misses, memory bandwidth, and standard OS metrics are available in perf-stat(1)).
Under the hood, XProf leverages Linux performance monitoring subsystem using two key interfaces:
(1) Custom Host-Side Events via libpfm(3)
The libpfm(3) library
translates user-configured event strings (e.g., standard hardware counters or
specific network/PCIe driver events) into raw hardware/kernel performance
counter attributes. If you need to specify custom host-side DCN or PCIe events,
ensure your event strings are valid according to libpfm syntax.
Example of specifying custom host-side events:
jax.profiler.start(
    # ... Some other flags...
    advanced_configuration={'tpu_cpu_perf_counter_profile_events': 'branch-misses,cycles,L1-dcache-load-misses,L1-dcache-loads'})
(2) Raw Performance Attribute Configurations via perf_event_open(2)
For more advanced/raw event configurations (e.g., kernel-level multiplexing or memory controllers):
The underlying
perf_event_open(2)
system call is used by XProf to sample and count these host events.
To configure any perf_event_open attribute:
jax.profiler.start(
    # ... Some other flags...
    advanced_configuration={'tpu_cpu_perf_counter_configs': '<config1>:<type1>:<name1>,<config2>:<type2>:<name2>'})
Where:
configandtypematch the parameters of theperf_event_attrstruct underperf_event_open(2).nameis a user-defined string display name for the Trace Viewer.
CPU Performance Counter Sampling Interval
To configure the interval (in milliseconds) at which CPU performance counters are collected, use:
jax.profiler.start(
    # ... Some other flags...
    advanced_configuration={'tpu_cpu_perf_counter_interval_ms': <int_value>})
Adjust this value to balance sampling frequency against overhead. A smaller
interval gathers more frequent samples to capture fine-grained behavior within
short steps, while a larger interval prevents trace file bloat and CPU overhead
during long profiling runs. If tpu_cpu_perf_counter_interval_ms is not
specified, XProf falls back to its minimum supported sampling period of
10 ms.