Framework Op Stats Tool
You can use Framework Op Stats to see the performance statistics of framework-level operations (e.g., JAX or TensorFlow) executed on the host and accelerator during the profiling session. This tool is valuable for identifying potential targets for performance optimization by highlighting the most time-consuming operations during the profiled period.
Supported Platforms
Both TPU and GPU are supported.
Framework Op Stats Components
Framework Op Stats has the following key components:
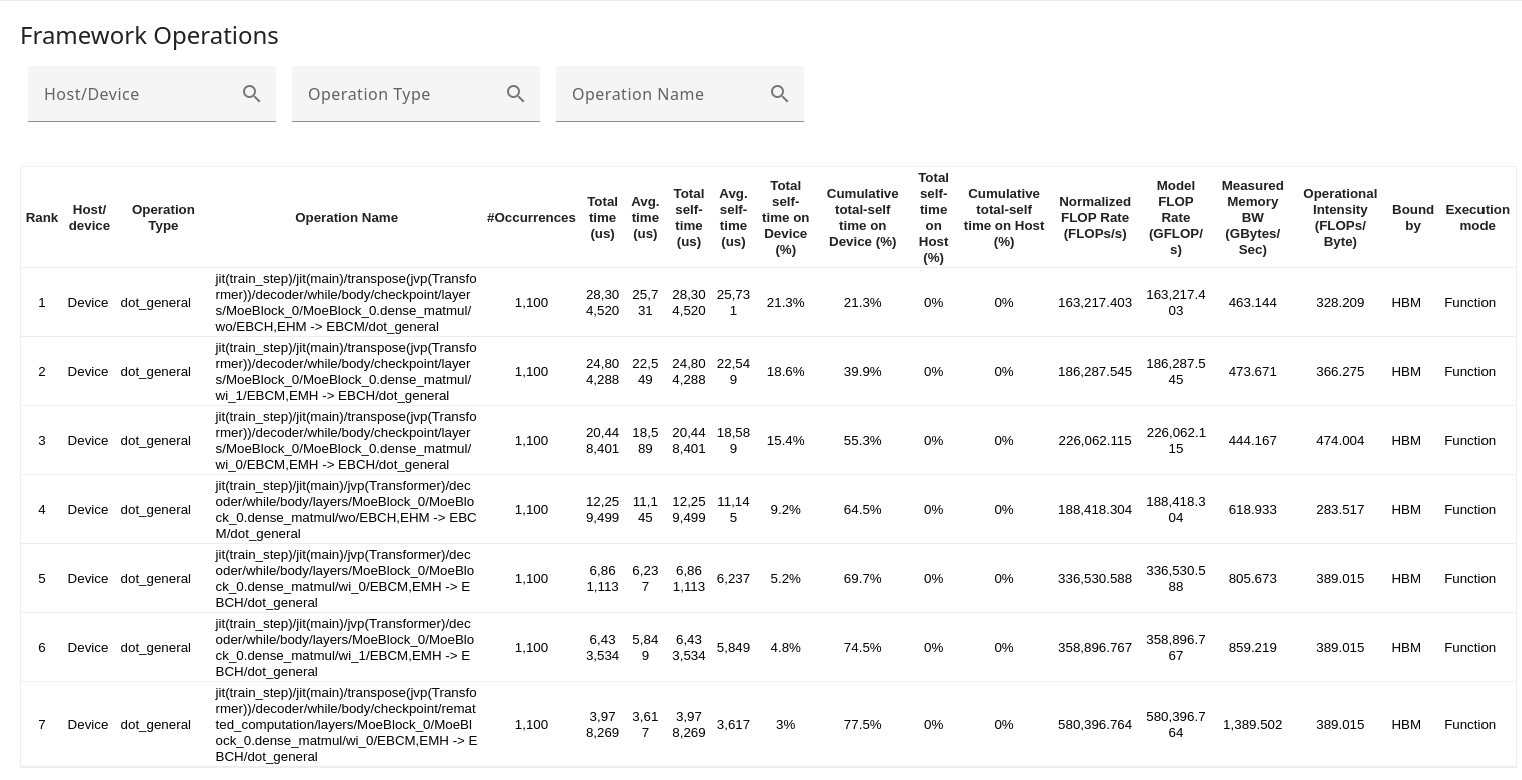
Framework operation statistics table: This is the primary component, presenting a detailed breakdown of every framework operation executed during the profiling session in a tabular format. There is one row for each distinct framework op, and columns that capture various details regarding that operation.
- Search boxes let you filter by host/device, the operation type, or the operation name; the filters select for the provided string that appears anywhere within the respective column.
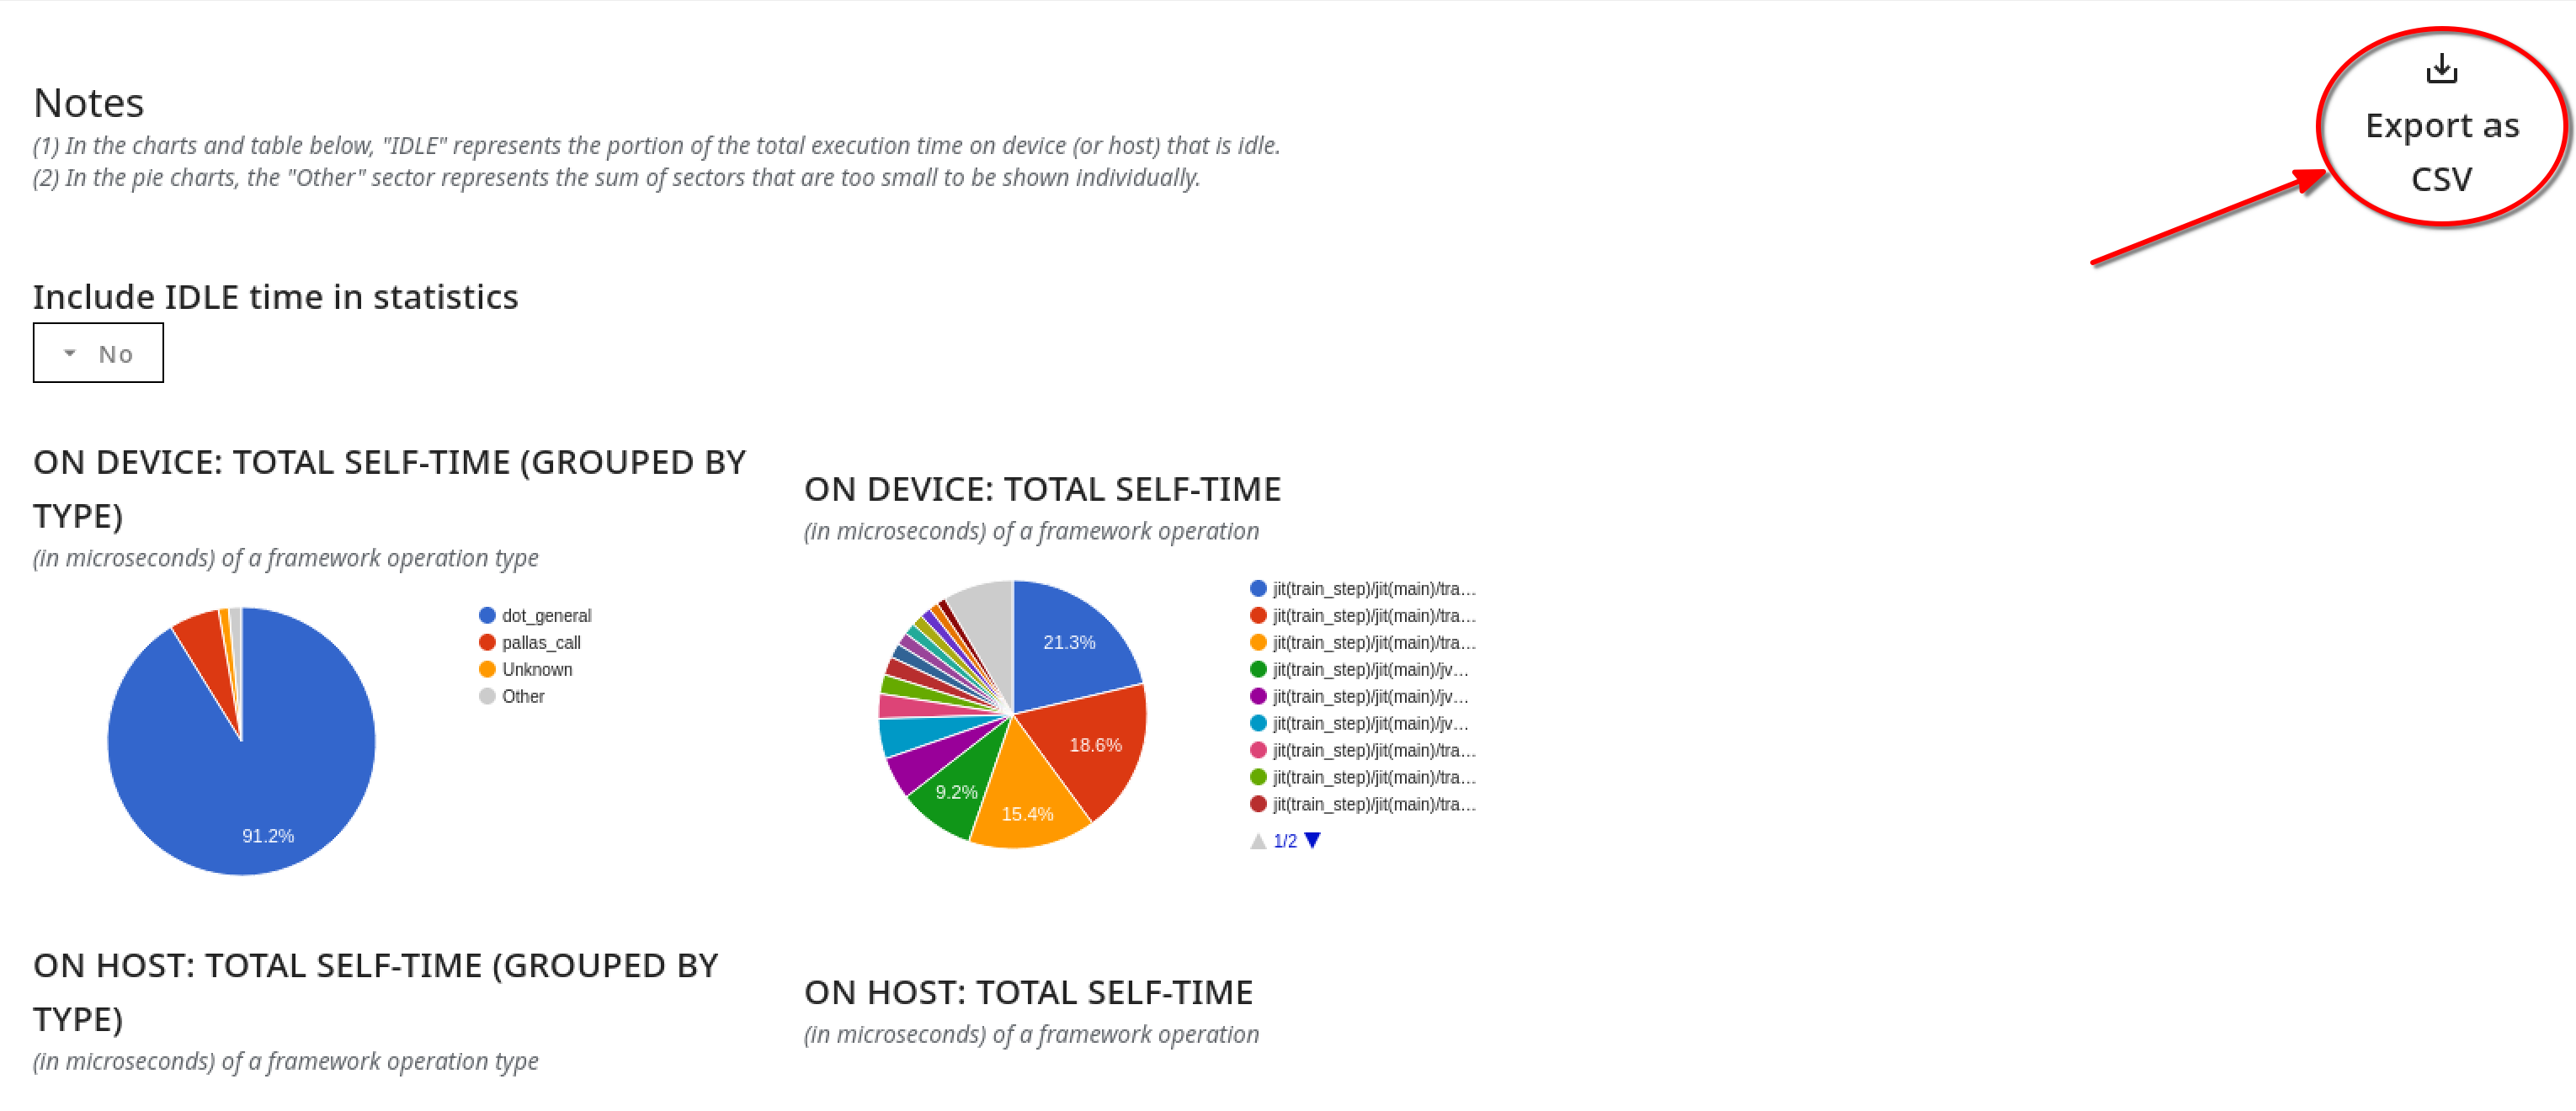
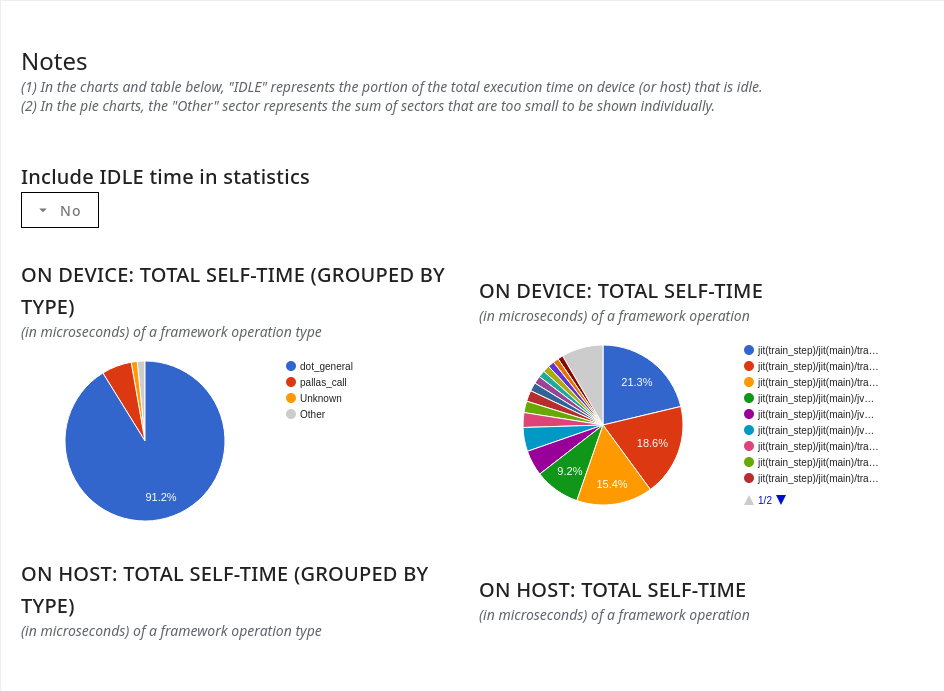
Summarized charts section: This section has charts that summarize the detailed per-op table, in the following ways:
- A pair of pie charts (one for the accelerator and one for the host) that show the fraction of time consumed by different categories of framework ops.
- A pie chart that shows the fraction of time consumed by different individual framework ops (truncated to the top-N ops, with the remaining classified as “Other” to improve readability)
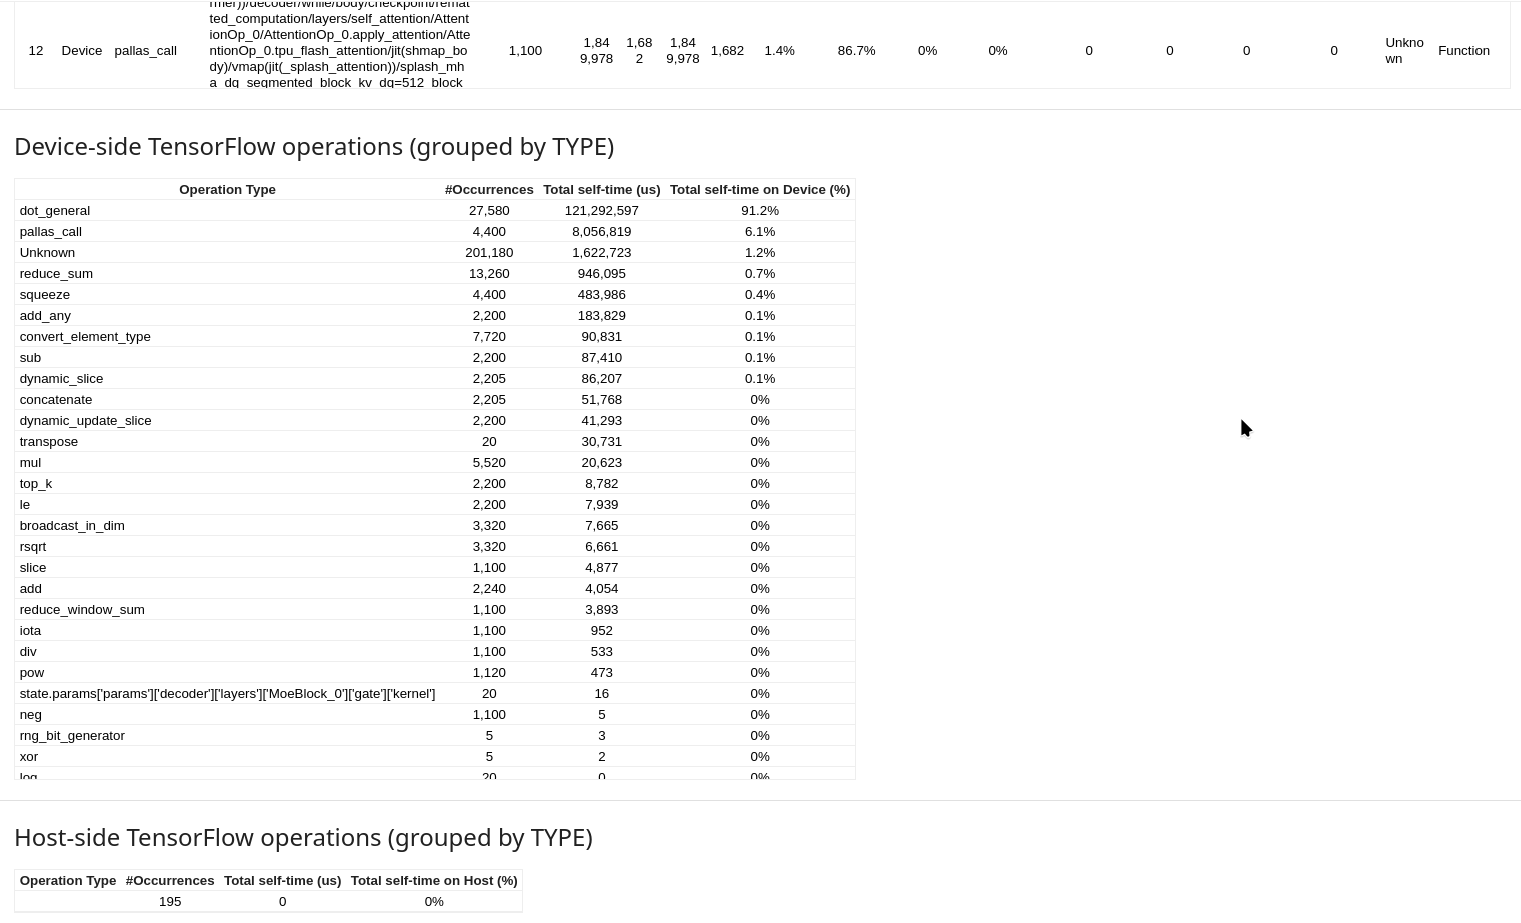
Summarized tables section: This section has a pair of tables (one for the accelerator and one for the host), with the number of occurrences, and total time consumed (both in absolute terms and as a fraction of total session time) by different categories of framework ops.
A drop-down selector lets you decide whether or not to include any idle time within the pie charts and summary tables.
Framework Operation Statistics Table Details
You can click any of the column headings to sort the framework operation statistics table. The default order is based on the total self time of the op (also labeled “rank” in the table).
The table includes the following information for each operation:
- Op execution location: Whether the operation is executed on host or device.
- Framework op type: These are derived directly from the operation name string (the last part of the call stack), to help with easy sorting.
- Framework op name: This is derived from the framework level metadata passed along to XProf by XLA.
- Occurrences: The total number of times this specific framework operation was executed during the profiling period.
- Total time (μs): The cumulative time spent executing this operation across all of its occurrences. If this operation has any child operations, this time includes the time spent in those children.
- Average time (μs): The average time per execution of this operation, including any time spent in children ops, if any.
- Total self time (μs): The cumulative time spent solely within the body of this HLO operation, excluding any time spent in its children operations.
- Average self time (μs): The average time per execution of this operation, excluding any time spent in its children operations.
- Total self time on Device (%): The self time of the op as a percentage of the total time on the device across all ops.
- Cumulative total self time on device (%): A running sum of total self time (%) for all ops that appear earlier in the currently sorted order.
- Total self time on host (%): The self time of the op as a percentage of the total time on the host across all ops.
- Cumulative total self time on host (%): A running sum of total self time (%) for all ops that appear earlier in the currently sorted order.
You can use the Export as CSV button on the right side of the upper pane to export the data from this table as a CSV file, and use the pretty-print checkbox for a more human-friendly presentation.