
Trace Viewer Tool
You can use Trace Viewer to visualize the timeline of events that occurred during the profiling session. It displays the durations of operations executed by your model on different parts of the system, such as the host (CPU) and accelerators (GPUs or TPUs). This enables you to understand how your model utilizes hardware resources, identify performance bottlenecks, and optimize your model for faster execution.
Supported Platforms
Both TPU and GPU are supported.
The Trace Viewer for GPUs groups events on timelines per GPU chip and the streams within it, while for TPUs, it organizes events on timelines per TPU chip and core. In either case, Trace Viewer also presents events on timelines per-thread for the host CPU that the accelerators are connected to.
Interacting with the Timeline
Trace Viewer provides several tools and methods for navigating and examining the timeline:
- Navigation: After clicking an event in the timeline, you can use the
following keyboard shortcuts:
- W: Zoom in.
- S: Zoom out.
- A: Pan left.
- D: Pan right.
- Tool selector: A floating tool selector contains tools you can use by
clicking on corresponding icons, or by using the corresponding keyboard
shortcuts:
- Selection Tool (1 or !): Click an event to select it and view its details in the Details pane. Select multiple events via ctrl+click to see a summary.
- Pan Tool (2 or @): Drag to move the timeline horizontally or vertically.
- Zoom Tool (3 or #): Drag to zoom into a specific area of the timeline.
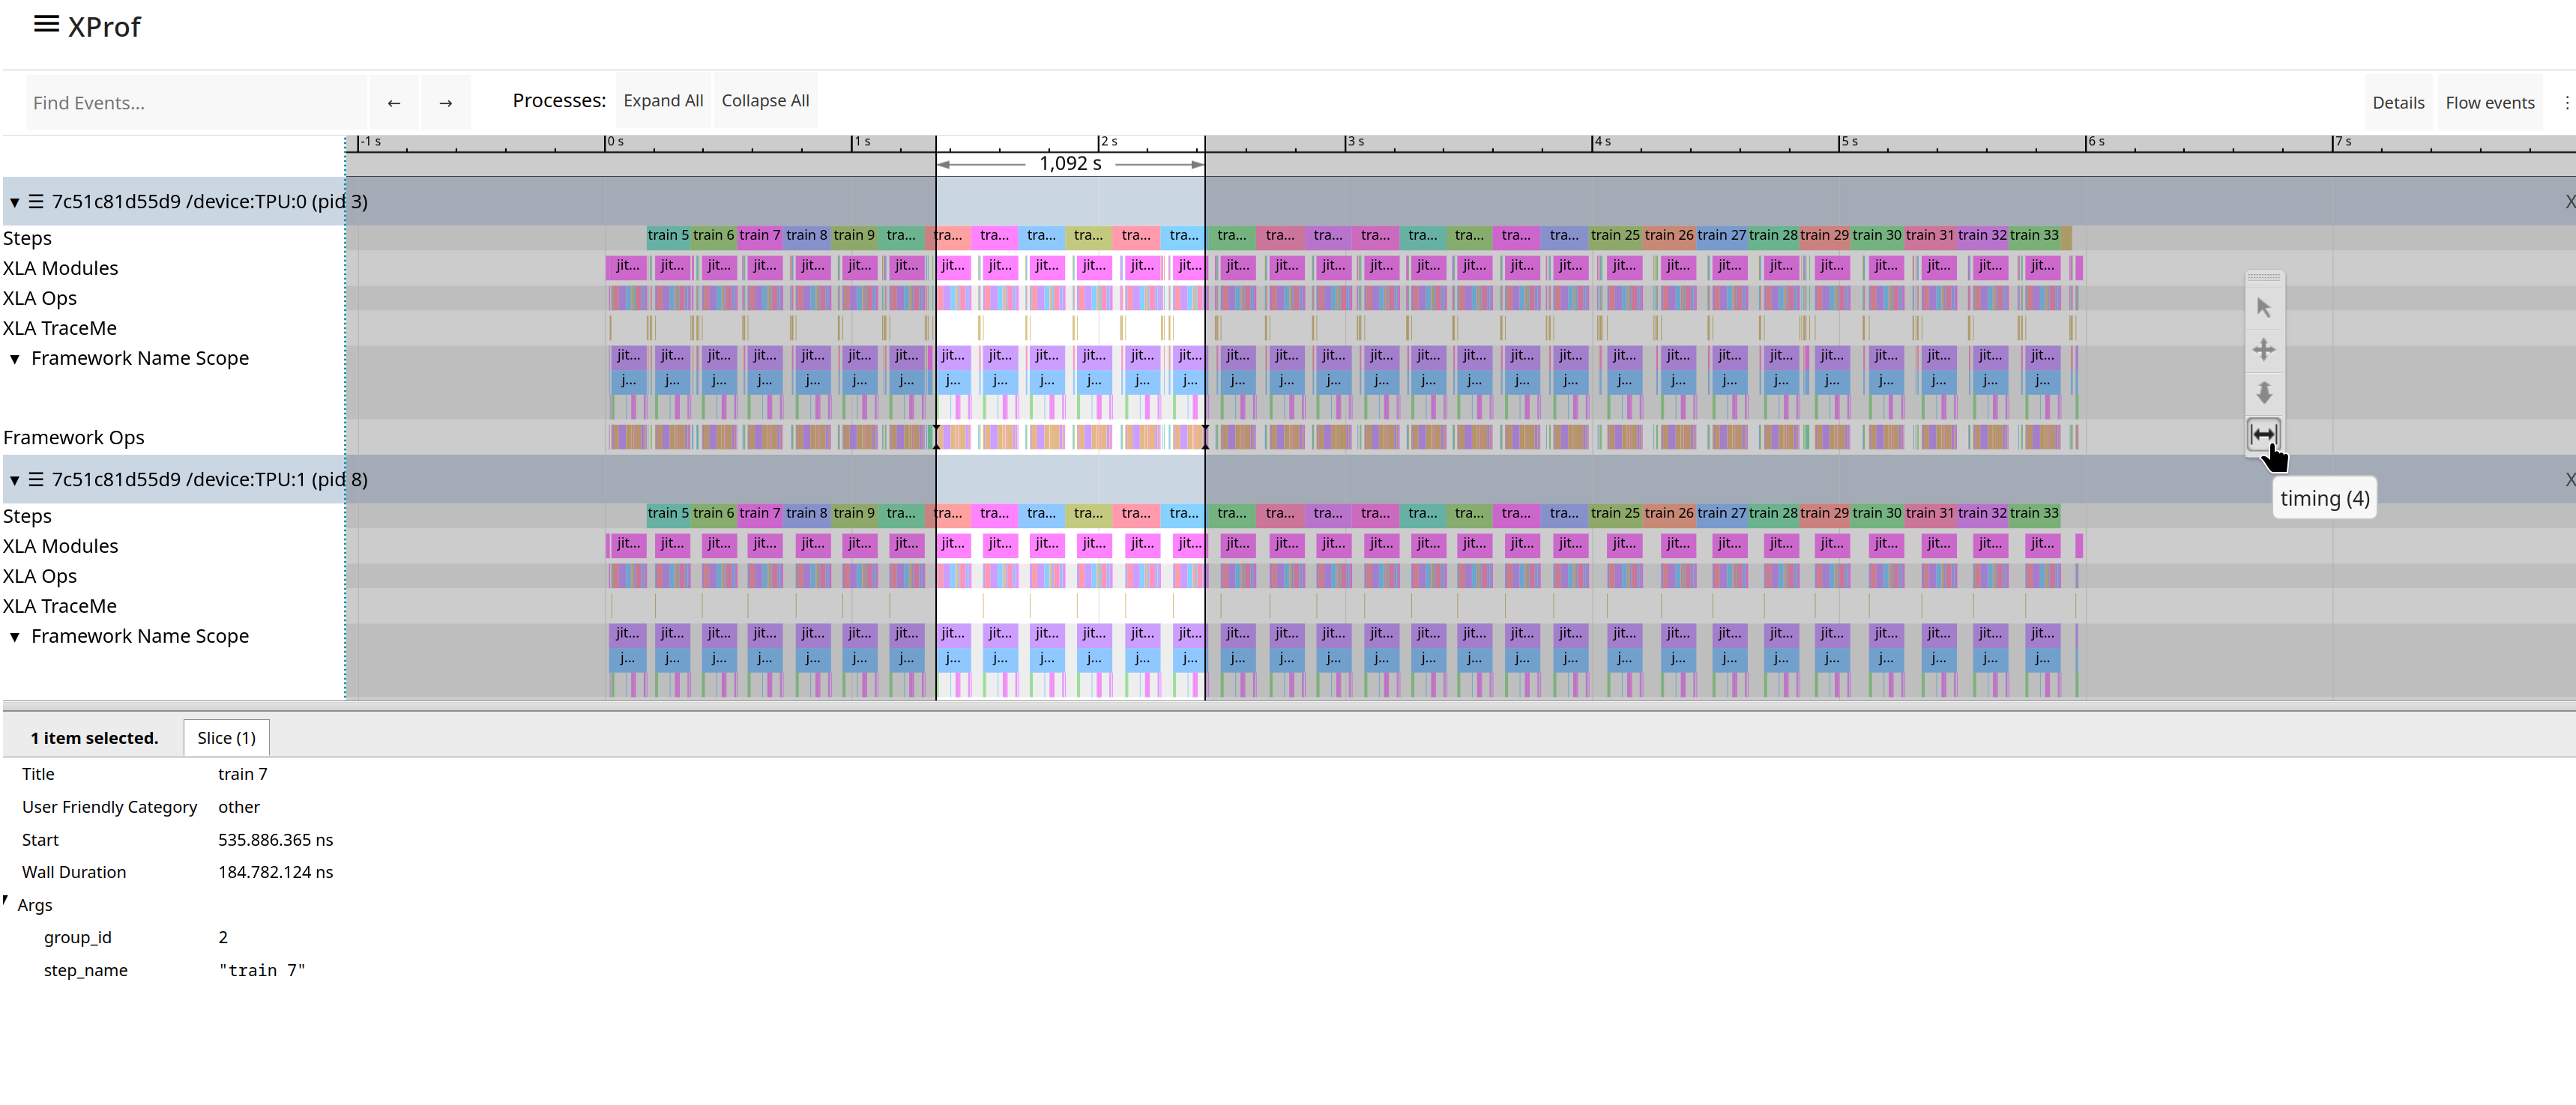
- Timing Tool (4 or $): Drag to mark a time interval. The duration of the marked interval will be displayed. You can also use the 'm' key to mark a selection and determine its total duration.
- Zoom to selected events (f): Select one or more events and press the 'f' key to quickly zoom into that portion of the timeline. This is useful for focusing on a specific training step.
When handling a large number of trace events, Trace Viewer works in streaming mode. This means it loads data on demand as you pan and zoom across the timeline, similar to how map applications work. If you zoom faster than the data can load, you might see a low-resolution representation of the data until it finishes loading.
Trace Viewer Interface Components
Here are the main UI components in Trace Viewer:
- The time axis runs horizontally at the top, showing time relative to the start of the trace.
- Timelines are organized by sections and tracks, with labels located on the left vertical axis. Each section represents a processing element (e.g., a device node or host threads) and can be expanded or collapsed. Within each section are tracks, which are timelines for specific activities.
- Events are the colored, rectangular blocks on the timeline tracks, representing the duration of an operation or a meta-event like a training step. The color of the events does not have a specific meaning.
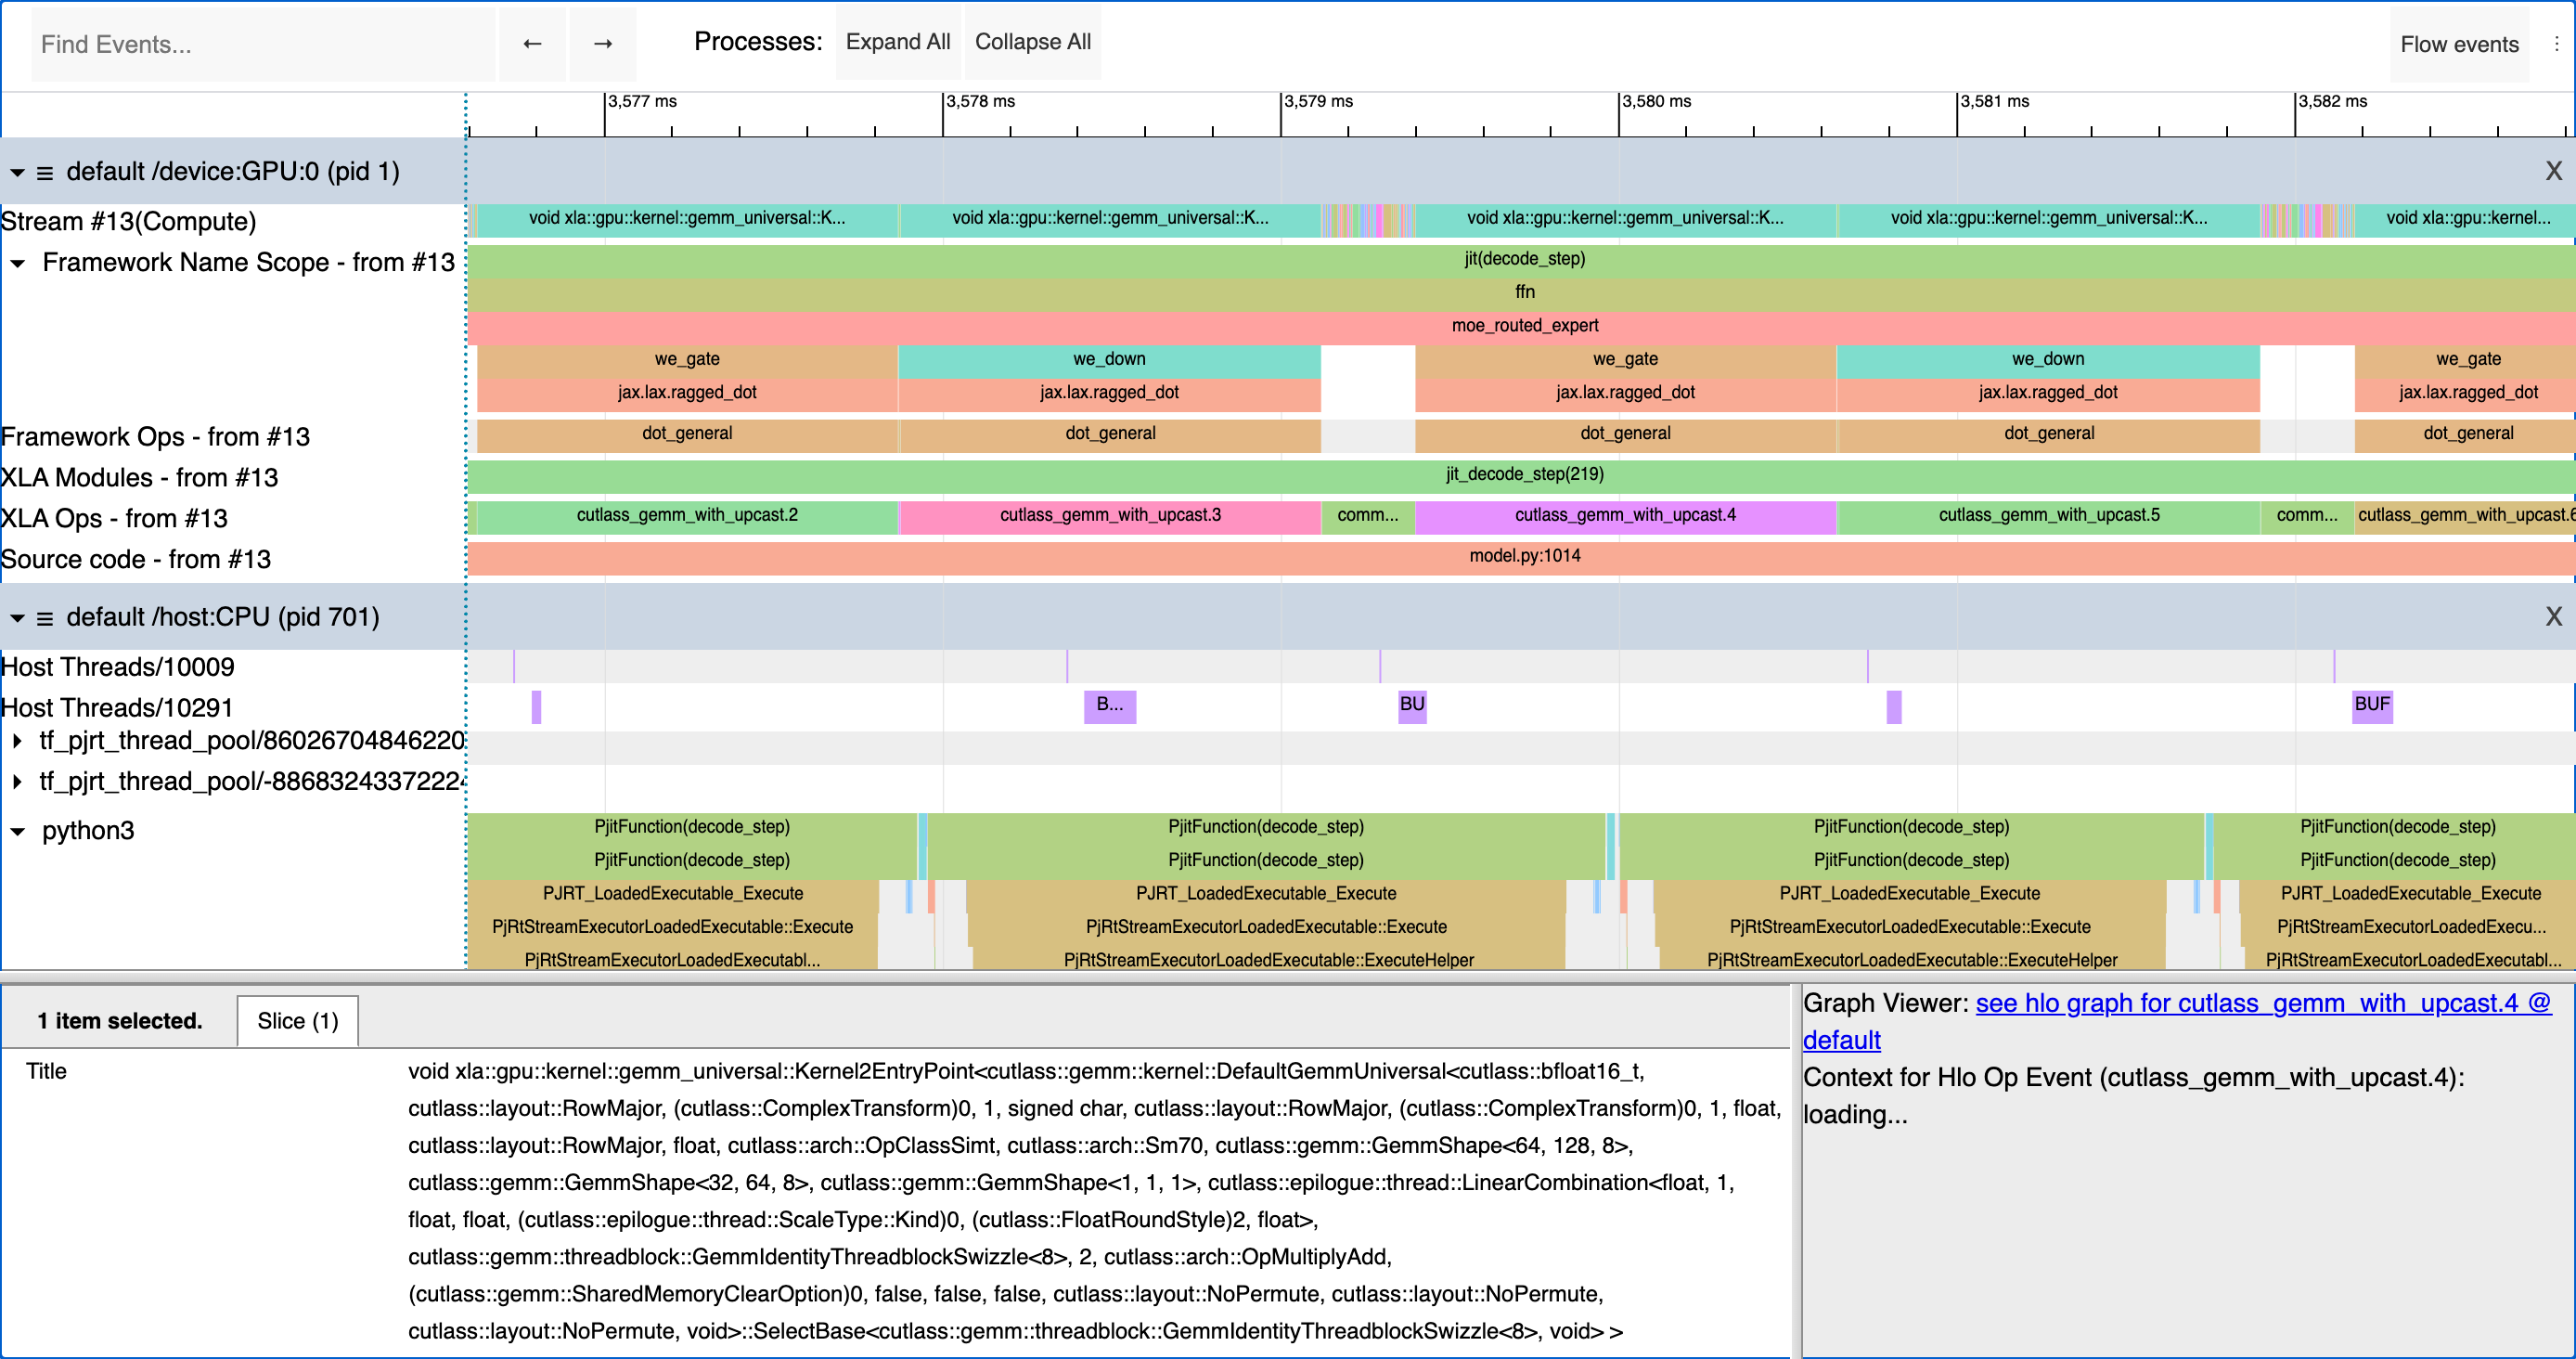
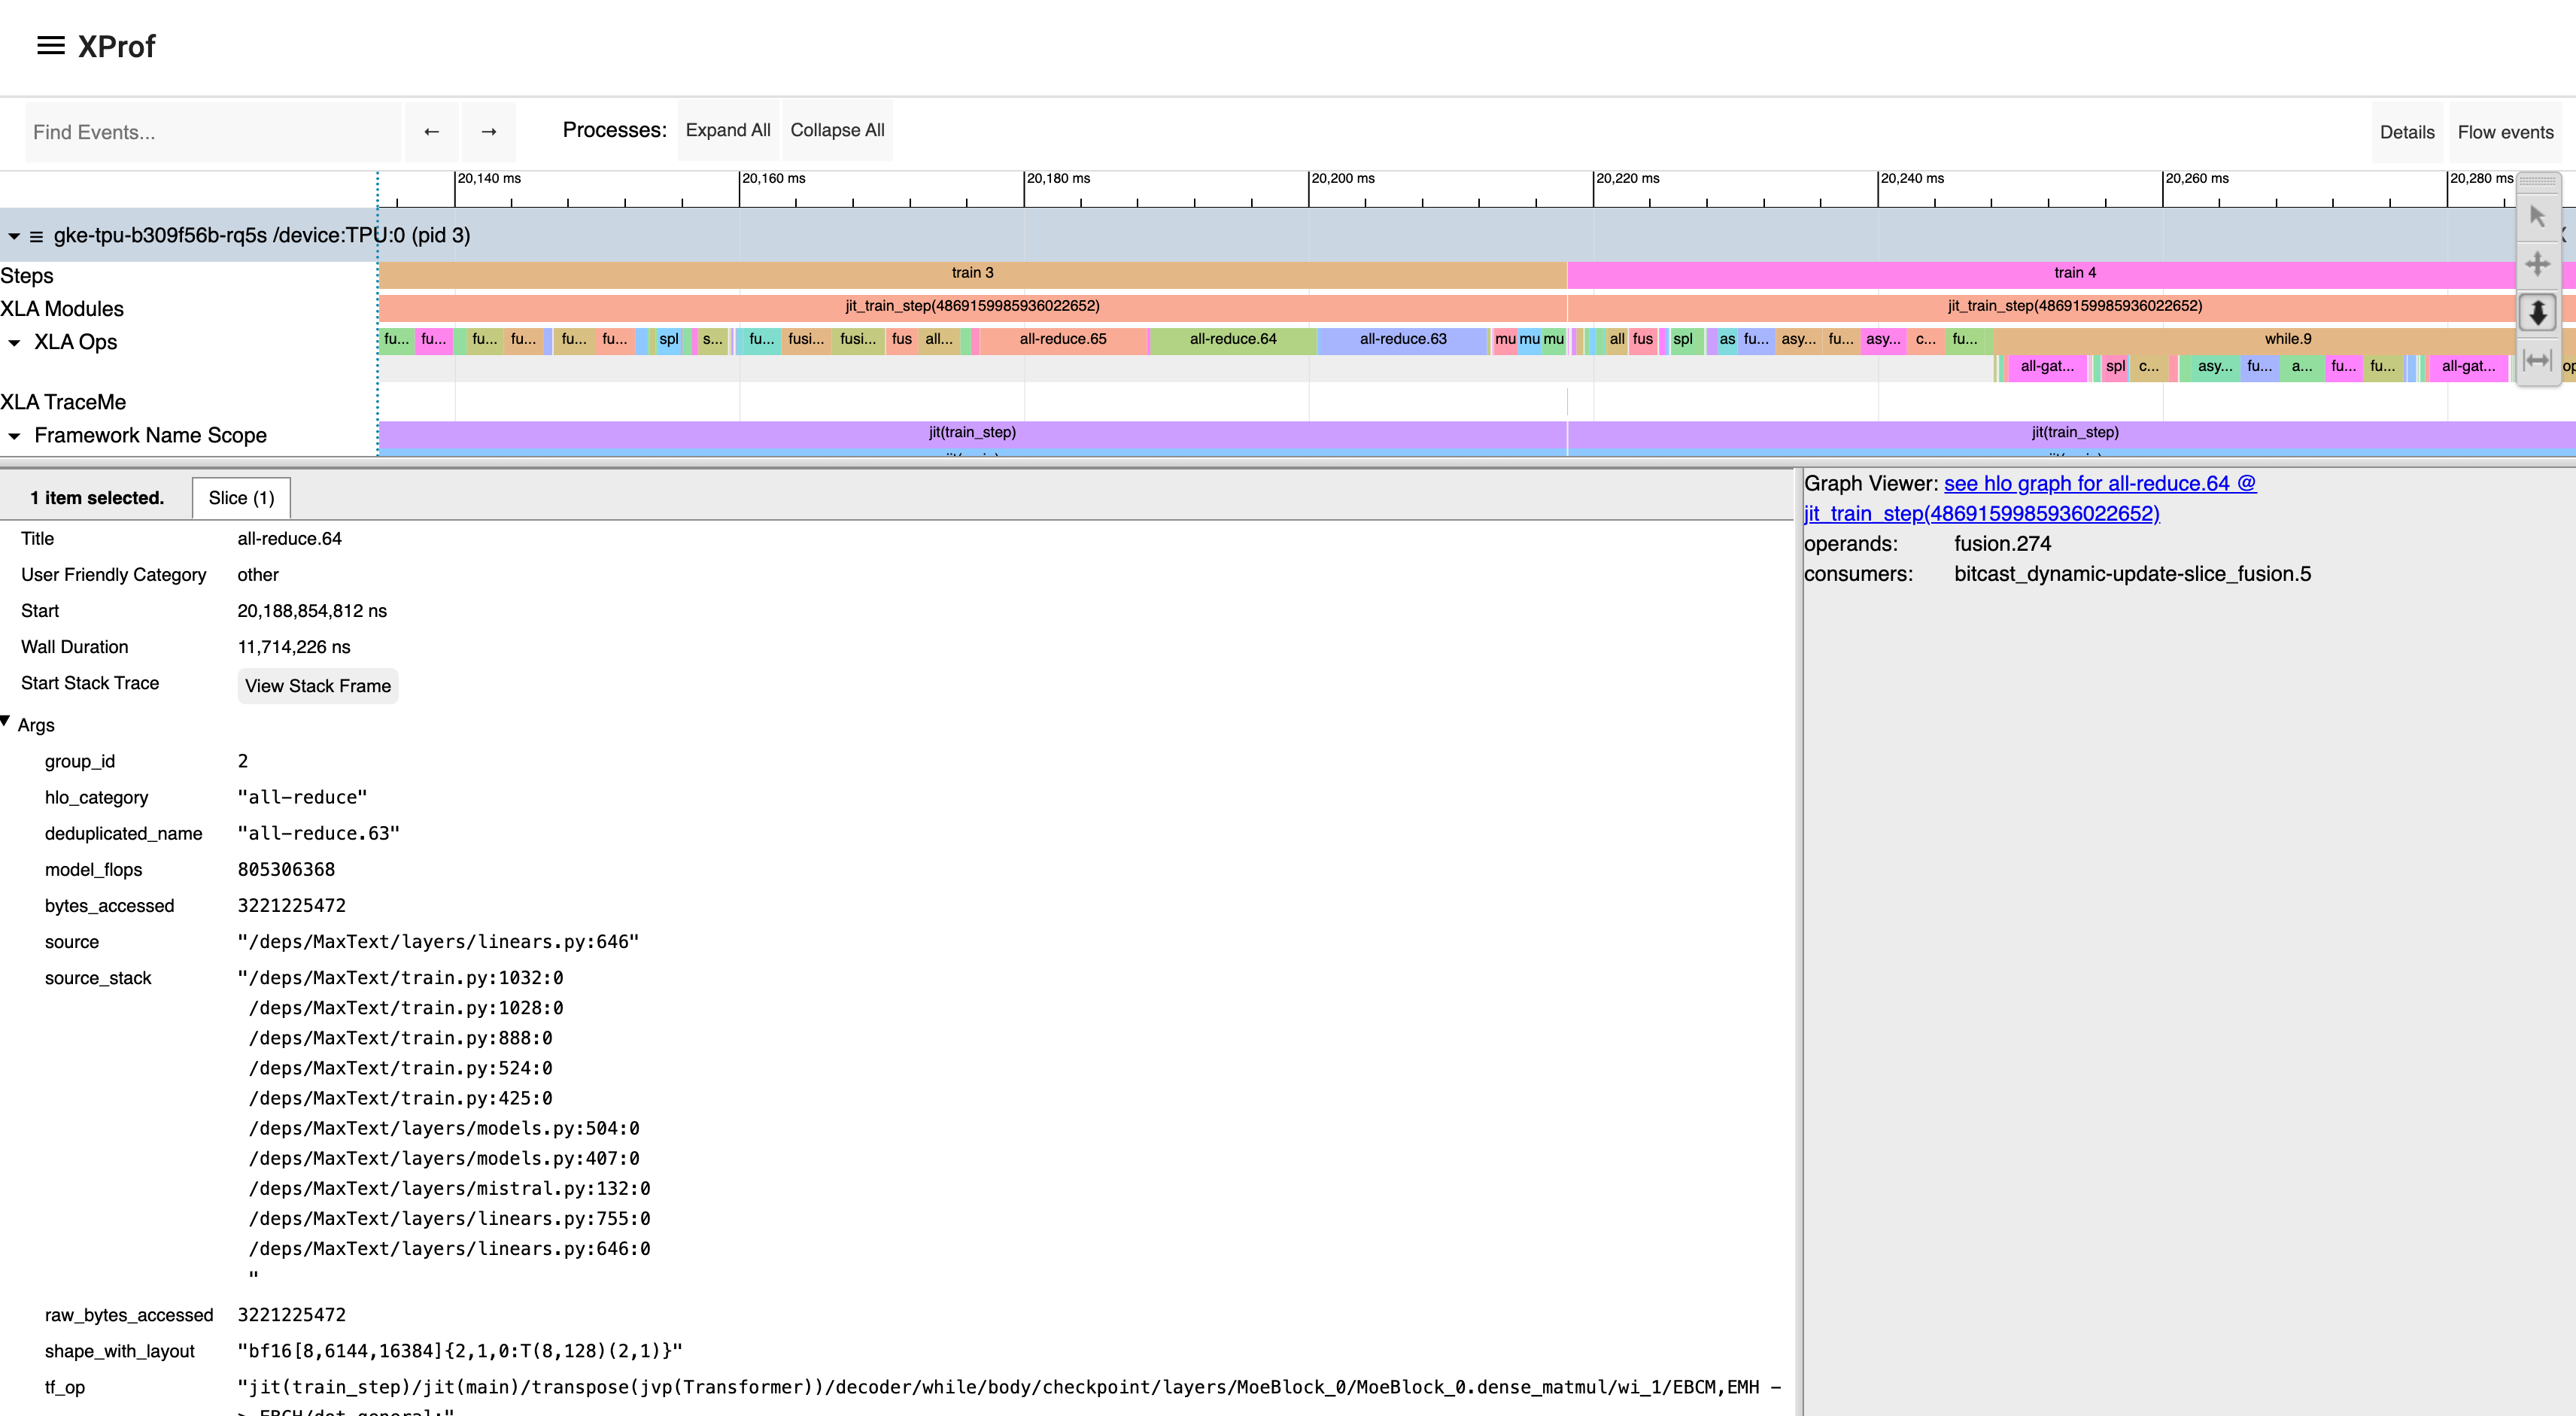
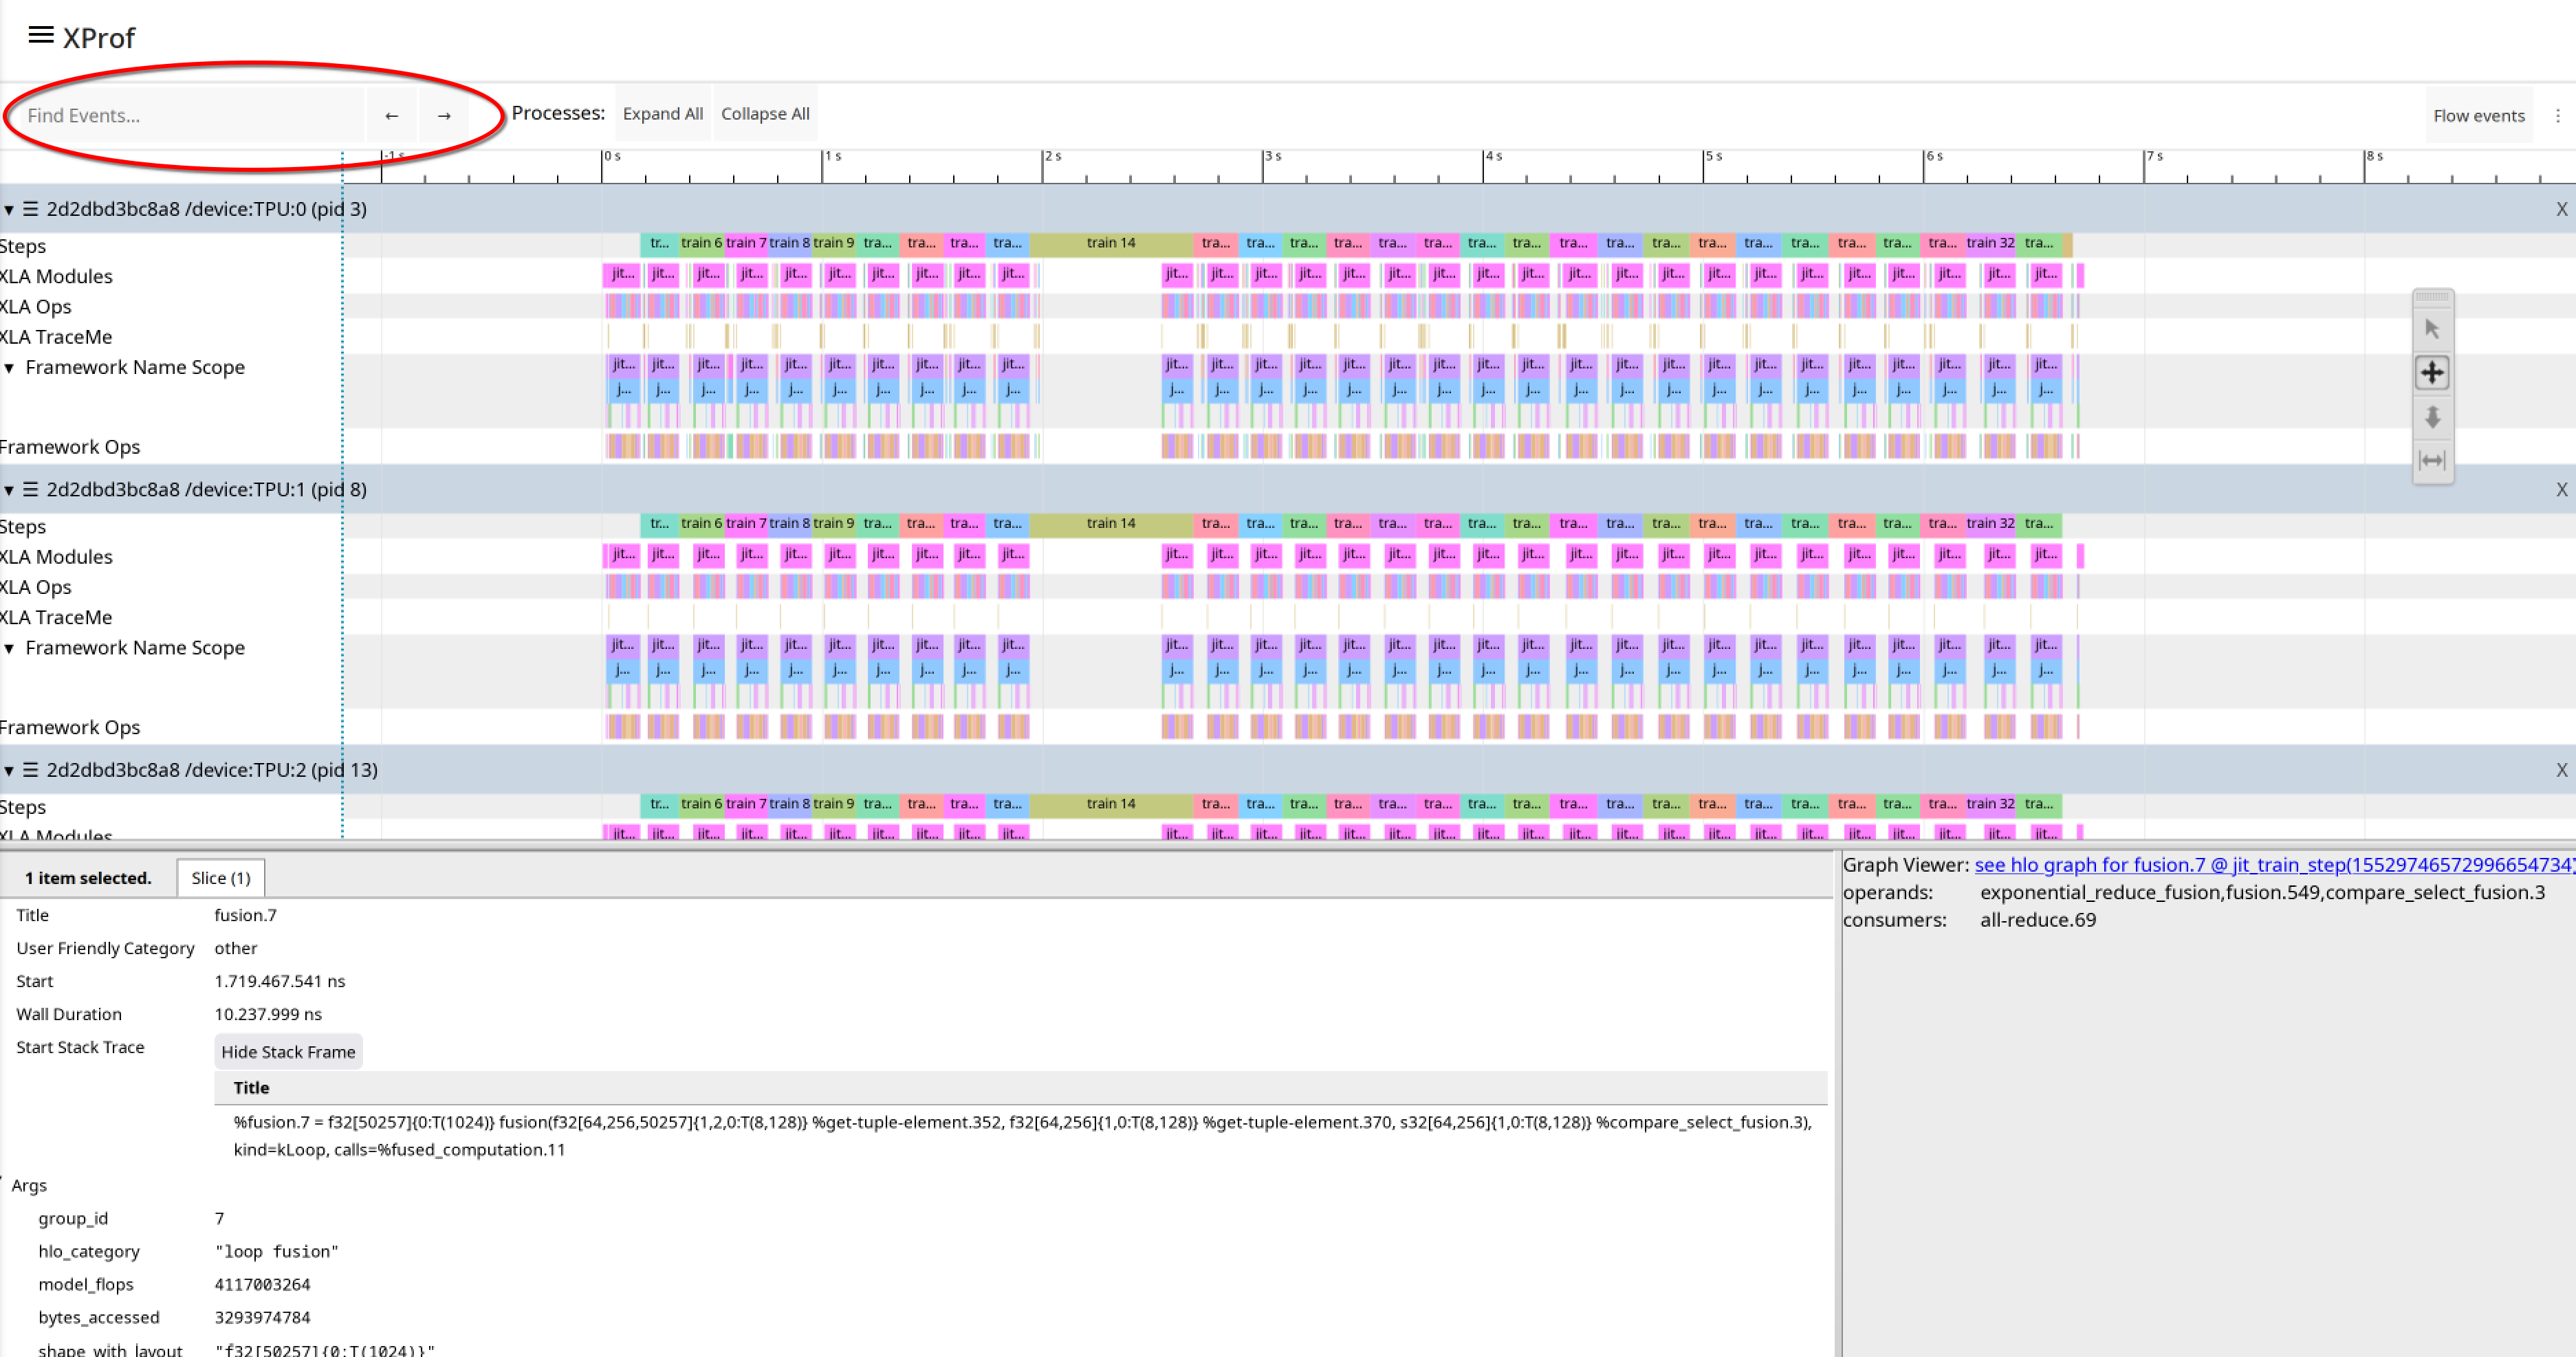
The details pane, which appears at the bottom of the timeline when one or more events are selected, shows additional information about the selected events, such as their name, start time and duration. When an XLA operation is selected, you can see links to the op in the Graph Viewer tool and other information that can be made available by the framework and compiler, including pointers to source code and/or the Python stack trace, the framework op that caused this XLA op to get generated, etc. It may also show FLOPS (number of floating point operations executed by the op) and bytes accessed by the op. This information is statically acquired from XLA during compilation, rather than runtime information from the profile.
Trace Viewer v2
For very large profiles (hundreds of MBs or GBs), you can use Trace Viewer v2 for a smoother experience navigating through millions of events. It uses WebGPU/Canvas for high-performance rendering.
To switch to Trace Viewer v2, click the "Switch to V2" button in the Trace Viewer UI. This is currently the only way to switch to the v2 frontend.
Typical Sections and Tracks
Trace Viewer provides the following sections and tracks.
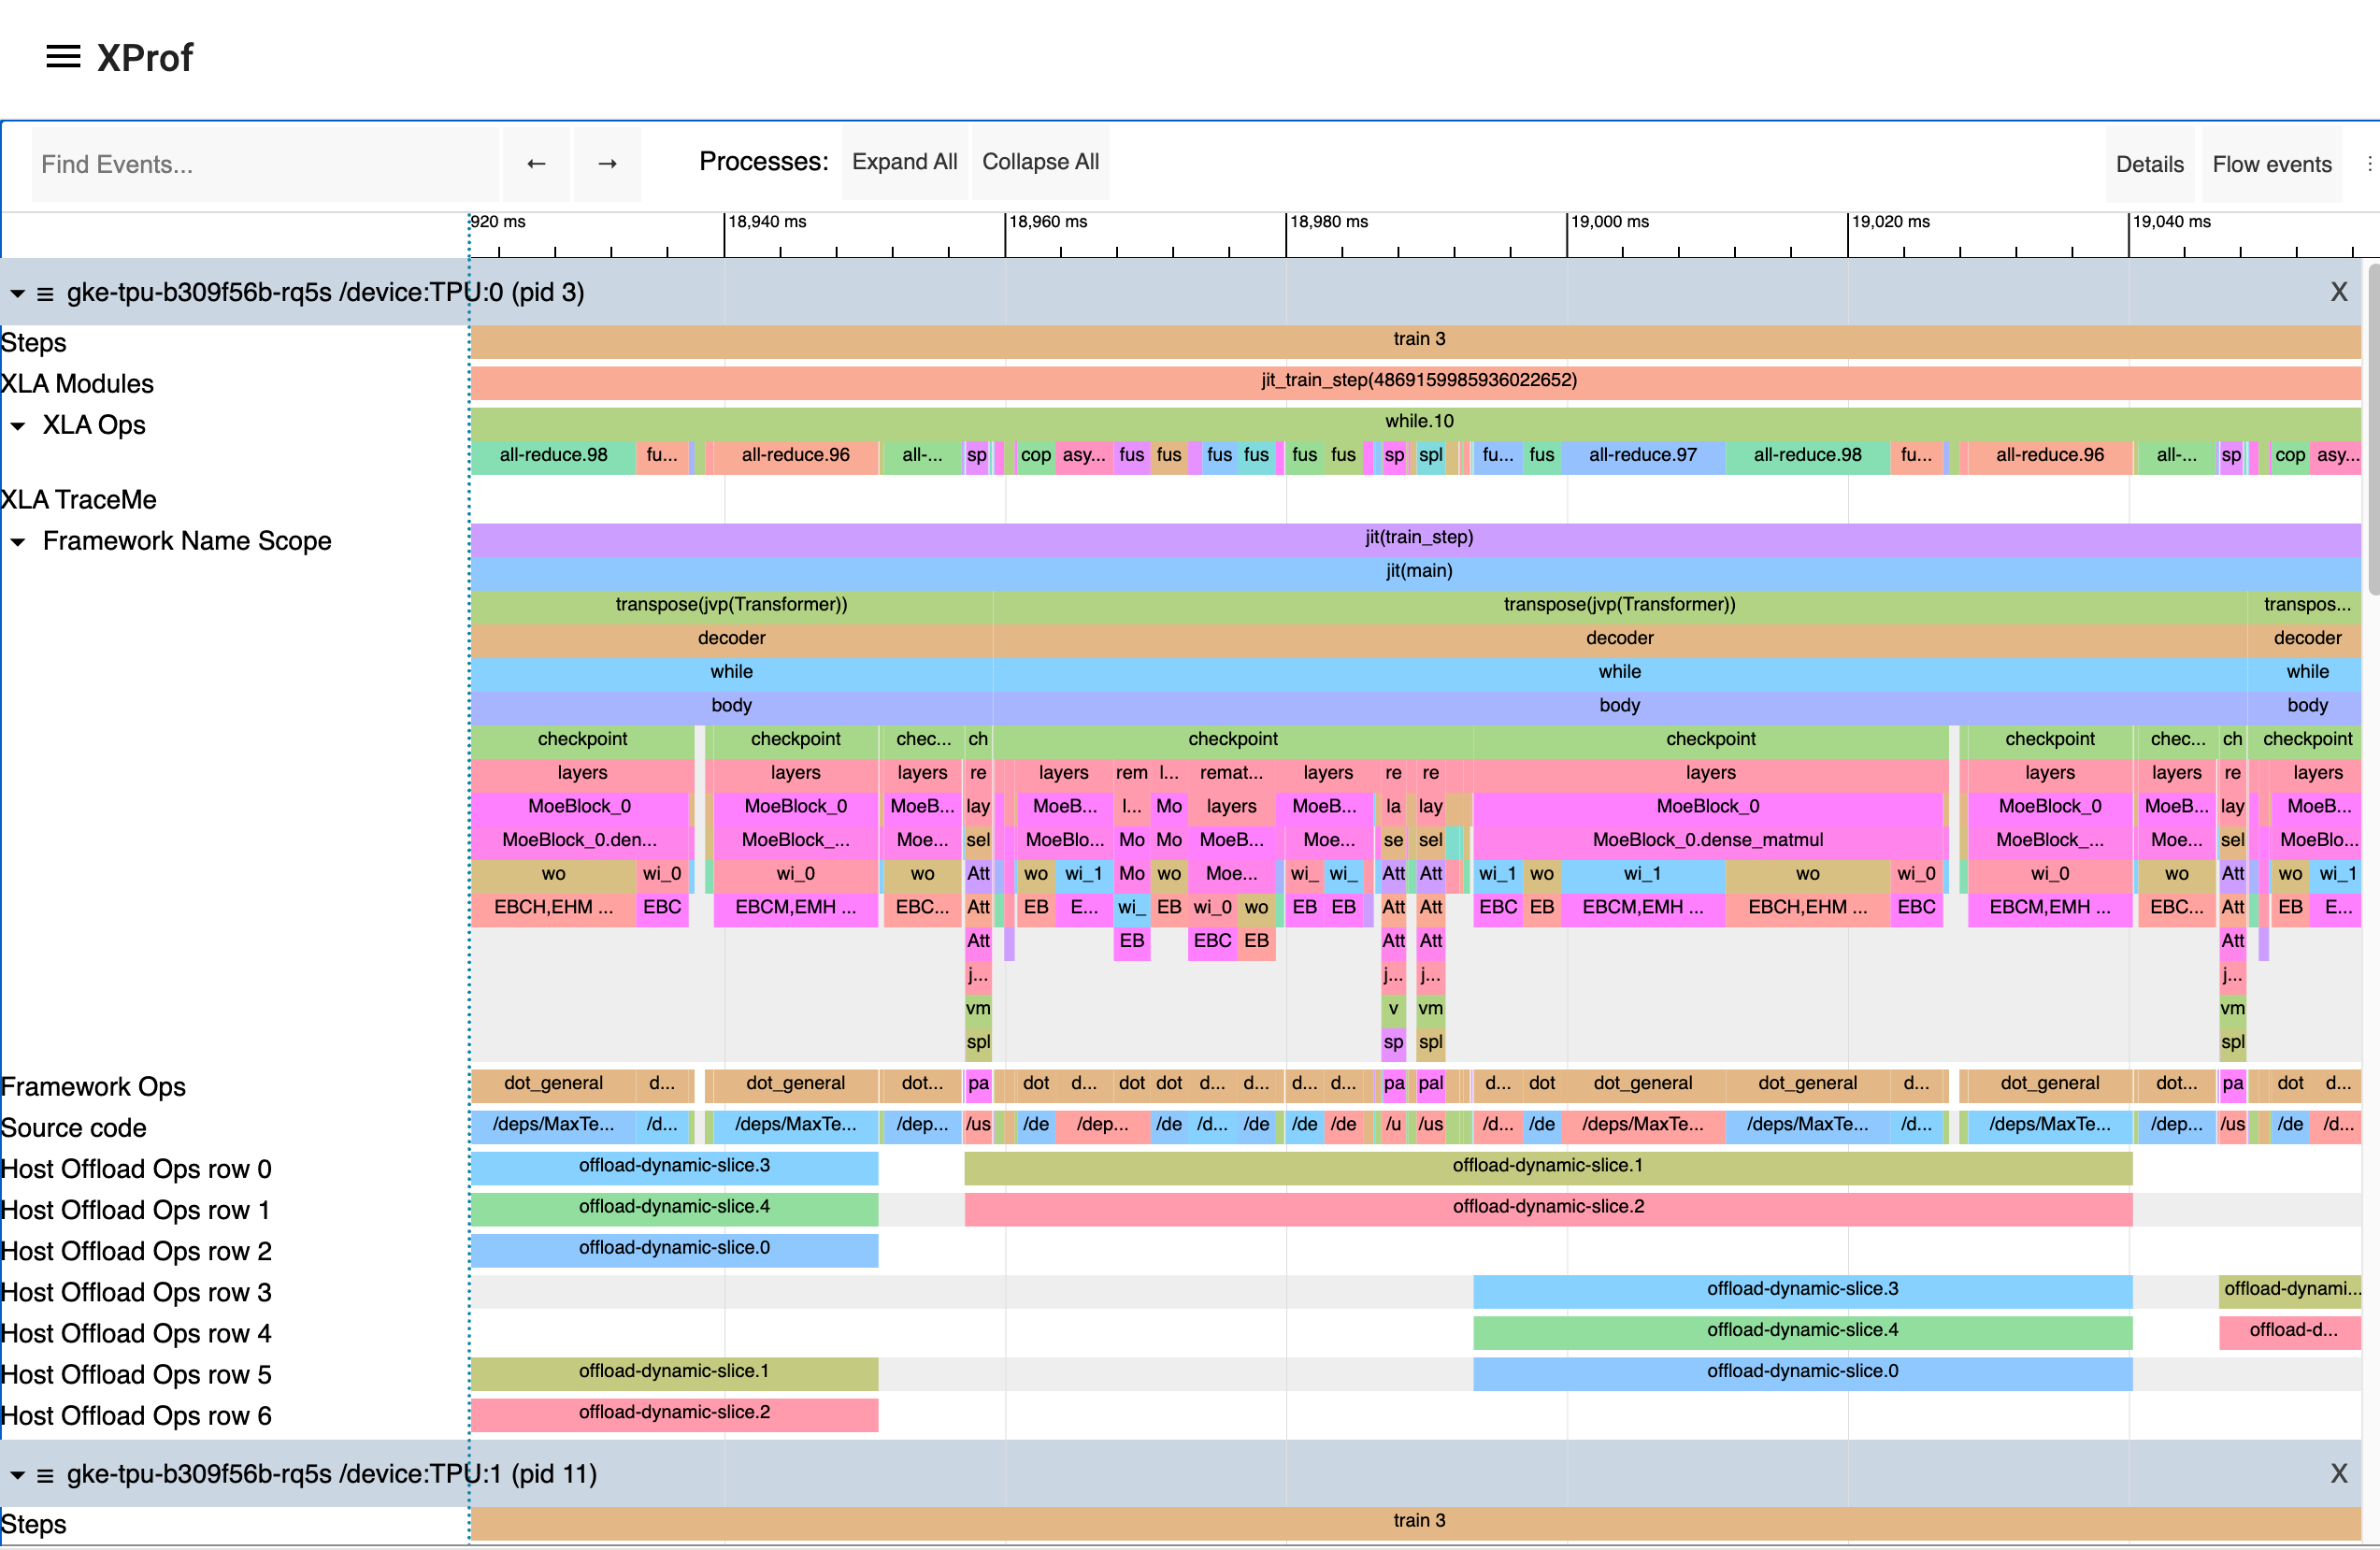
- One section for each TPU node, with the following tracks:
- Steps: Shows the duration of the training steps running on that TPU core, if appropriately annotated in the user program or framework.
- XLA Modules: the XLA program being executed.
- XLA Ops: Shows the XLA HLO operations that ran on the TPU core. Each higher-level framework operation (JAX, Tensorflow, or PyTorch, for example) is translated into one or several XLA operations, which are then compiled to run on the TPU.
- XLA TraceMe: User-specified annotations in their code describing logical units of work they intend to track. You may still see data here even if you didn’t add any annotations; those are typically added by XLA (e.g., barrier cores), or XProf itself (e.g., dropped trace entries).
- Framework Name Scope: For each framework op, a visualization of the stack trace. For brevity, this track only appears for a single device.
- Framework Ops: Displays framework operations (JAX, Tensorflow, or PyTorch, for example) executed on the TPU core, if appropriately annotated in the user program or framework.
- Framework Name Scope: For each framework op, a visualization of the stack trace. For brevity, this track only appears for a single device.
- Source code: Path to the source code being executed, if available in the profile.
- Scalar unit: For TPUs, events executing on the scalar unit, depicted if present in the profile.
- TensorCore Sync Flags: Synchronization mechanism on TPUs, depicted if present in the profile.
- Host Offload: Ops that asynchronously move data between host memory and accelerator memory. There are typically corresponding start and stop ops that appear on the XLA Ops line indicating the accelerator getting prepared for the data transfer (e.g., marking source/destination memory regions as “in use” for the duration of the transfer). There may be multiple host offload rows present if there are multiple offload ops executing in parallel, requiring the trace viewer to concurrently display multiple events.
- LLO Utilization: Shows hardware resource utilization for XLA Custom Calls, if the corresponding XLA flags are enabled.
- One section for each Sparsecore node: Some TPU generations (e.g., TPU v5p and Trillium) are equipped with one or more SparseCore units in addition to the dense compute MXU units; modules, ops, and TraceMes associated with these cores will appear in this section.
- One section for each GPU node, with the following tracks:
- One track per stream, with the stream name also including information about the types of operations executed on the stream (Memcpy, Compute, etc.).
- Launch Stats: Shows the max and average time spent in the launch phase.
- Steps, XLA Modules, Framework Ops, Framework Name Scope, Source code: These are all similar to TPU sections.
- XLA TraceMe is not supported for GPUs.
- XLA Ops do appear in GPU sections, but these are not currently always accurate, since they are derived from the stream data. They therefore can’t fully account for the GPU’s execution model where there may be an N:M mapping of XLA Ops to the actual kernels that get executed on the different streams, and the dynamic scheduling of multiple streams onto different SMs in the hardware.
- One section for each component (e.g., one threadpool) running on the host machine's CPU, with one track per thread, in the case of threadpools. This is also where you will see Python traces if these were enabled during profile collection.
Note that only the XLA Ops for TPUs and stream data for GPUs are directly grounded in the collected profile; all other lines are “derived lines”, involving optional “sideband” information provided by the compiler, optional user annotations, and/or heuristics applied by XProf. Therefore, these derived lines may or may not appear in certain profiles.
Other Features
You can search for specific event names using the “Find events..” search bar. Currently, this only searches within the visible time-window on screen, rather than the full trace.
Flow Events: Enabling this option by clicking the “Flow Events” button in the top bar adds visualizations, linking events in one thread or line to events in another thread line. For example, there may be an arrow drawn from the op on the host that enqueues or launches work for an accelerator, to the op on the accelerator that executes that work. XProf determines these links via a combination of user annotations, built-in heuristics, and by post-processing information it receives from different components (e.g., CUPTI drivers, kernel launch IDs, TPU runtime information, etc.).
From Trace Viewer to HLO Graph
When you click on an XLA op in Trace Viewer, you can click the link in the details pane to view the corresponding op in the Graph Viewer tool. This allows you to understand the context of the op within the HLO graph, and see how it relates to other ops in the graph.
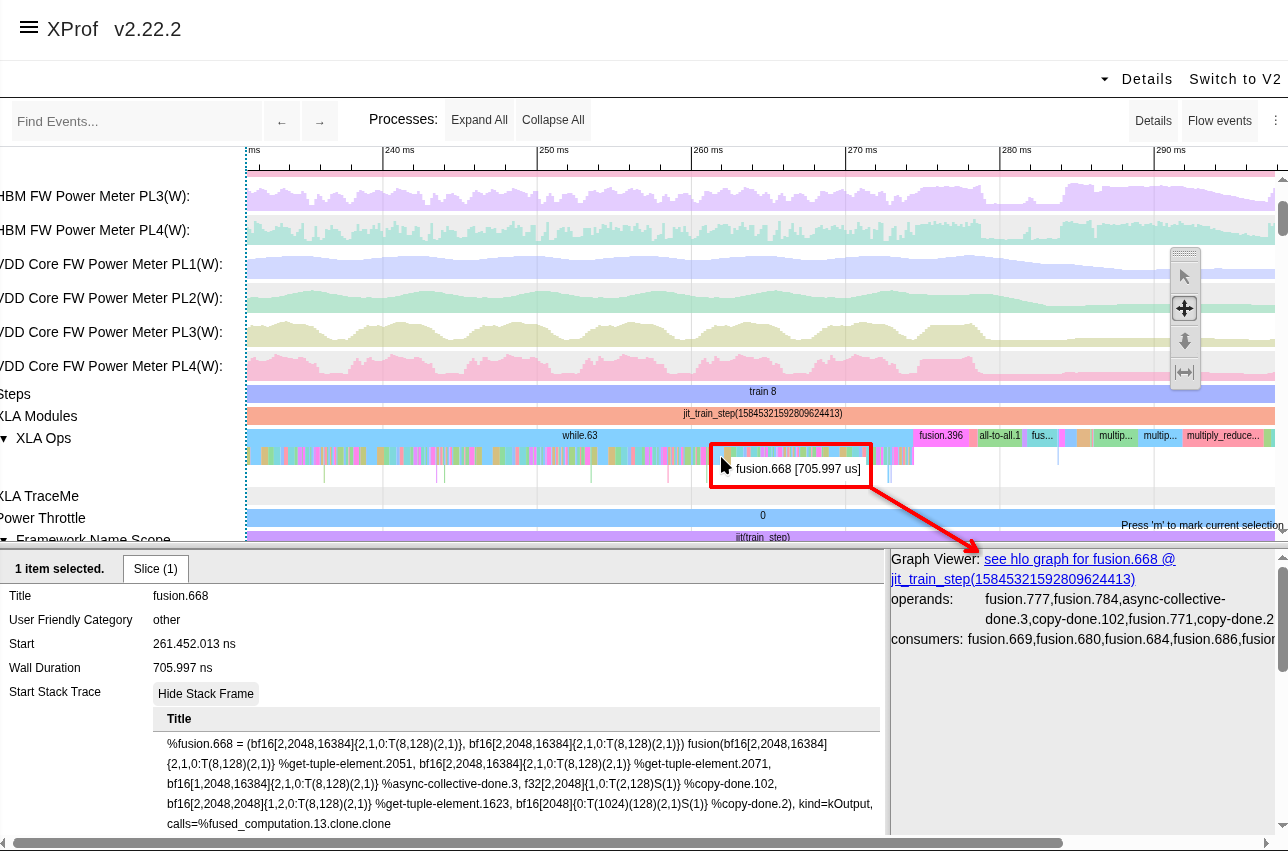 Clicking on an XLA operation in the Trace Viewer shows information, including a
link to the corresponding operation in the HLO Graph Viewer tool.
Clicking on an XLA operation in the Trace Viewer shows information, including a
link to the corresponding operation in the HLO Graph Viewer tool.
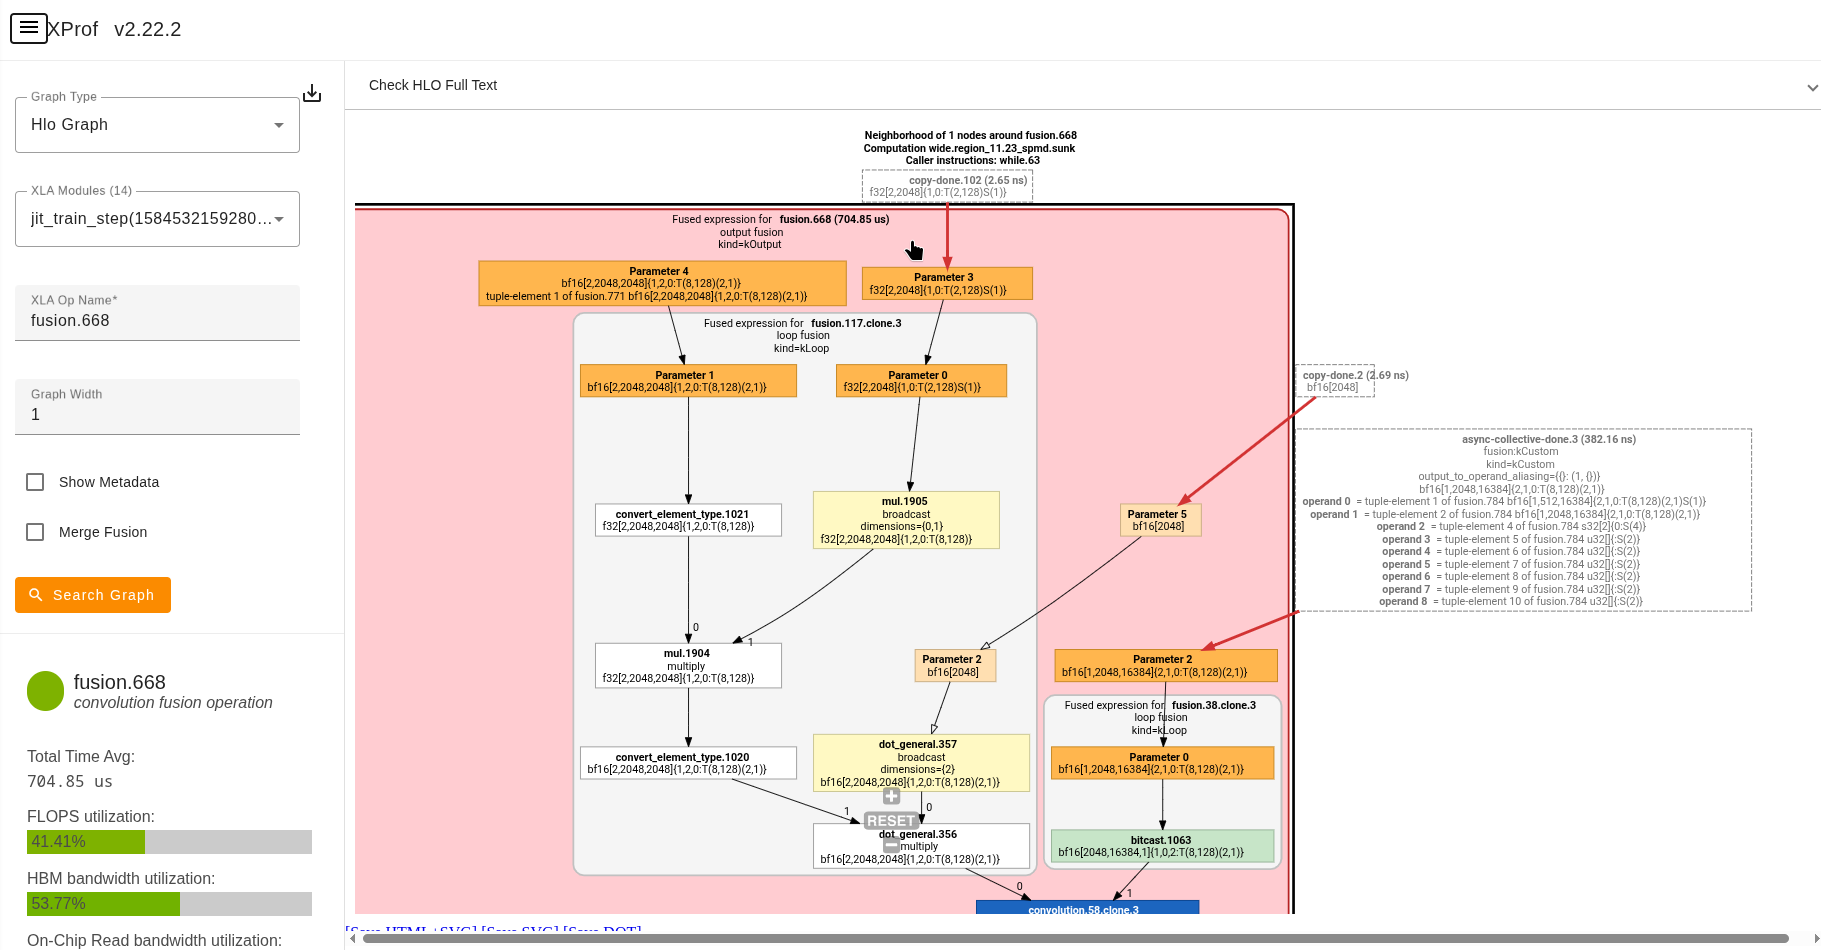 Note the same XLA
operation highlighted in the Graph Viewer, with its connections to other
operations in the HLO graph.
Note the same XLA
operation highlighted in the Graph Viewer, with its connections to other
operations in the HLO graph.