
Memory Profile Tool
You can use Memory Profile to visualize the memory usage over time of your accelerators. The Memory Profile tool monitors the memory usage of your device during the profiling interval. You can use this tool to:
- Debug out of memory (OOM) issues by pinpointing peak memory usage and the corresponding memory allocation to framework ops.
- Debug memory fragmentation issues.
Supported Platforms
Both TPU and GPU are supported.
Using the Memory Profile Tool
Memory Profile has the following components:
- The Host ID selector at the top of the page lets you choose between different hosts to profile.
The Memory ID selector at the top of the page lets you focus on the High Bandwidth Memory (HBM) attached to one of the different accelerators that may be connected to the host being profiled, or even the host memory in certain cases.
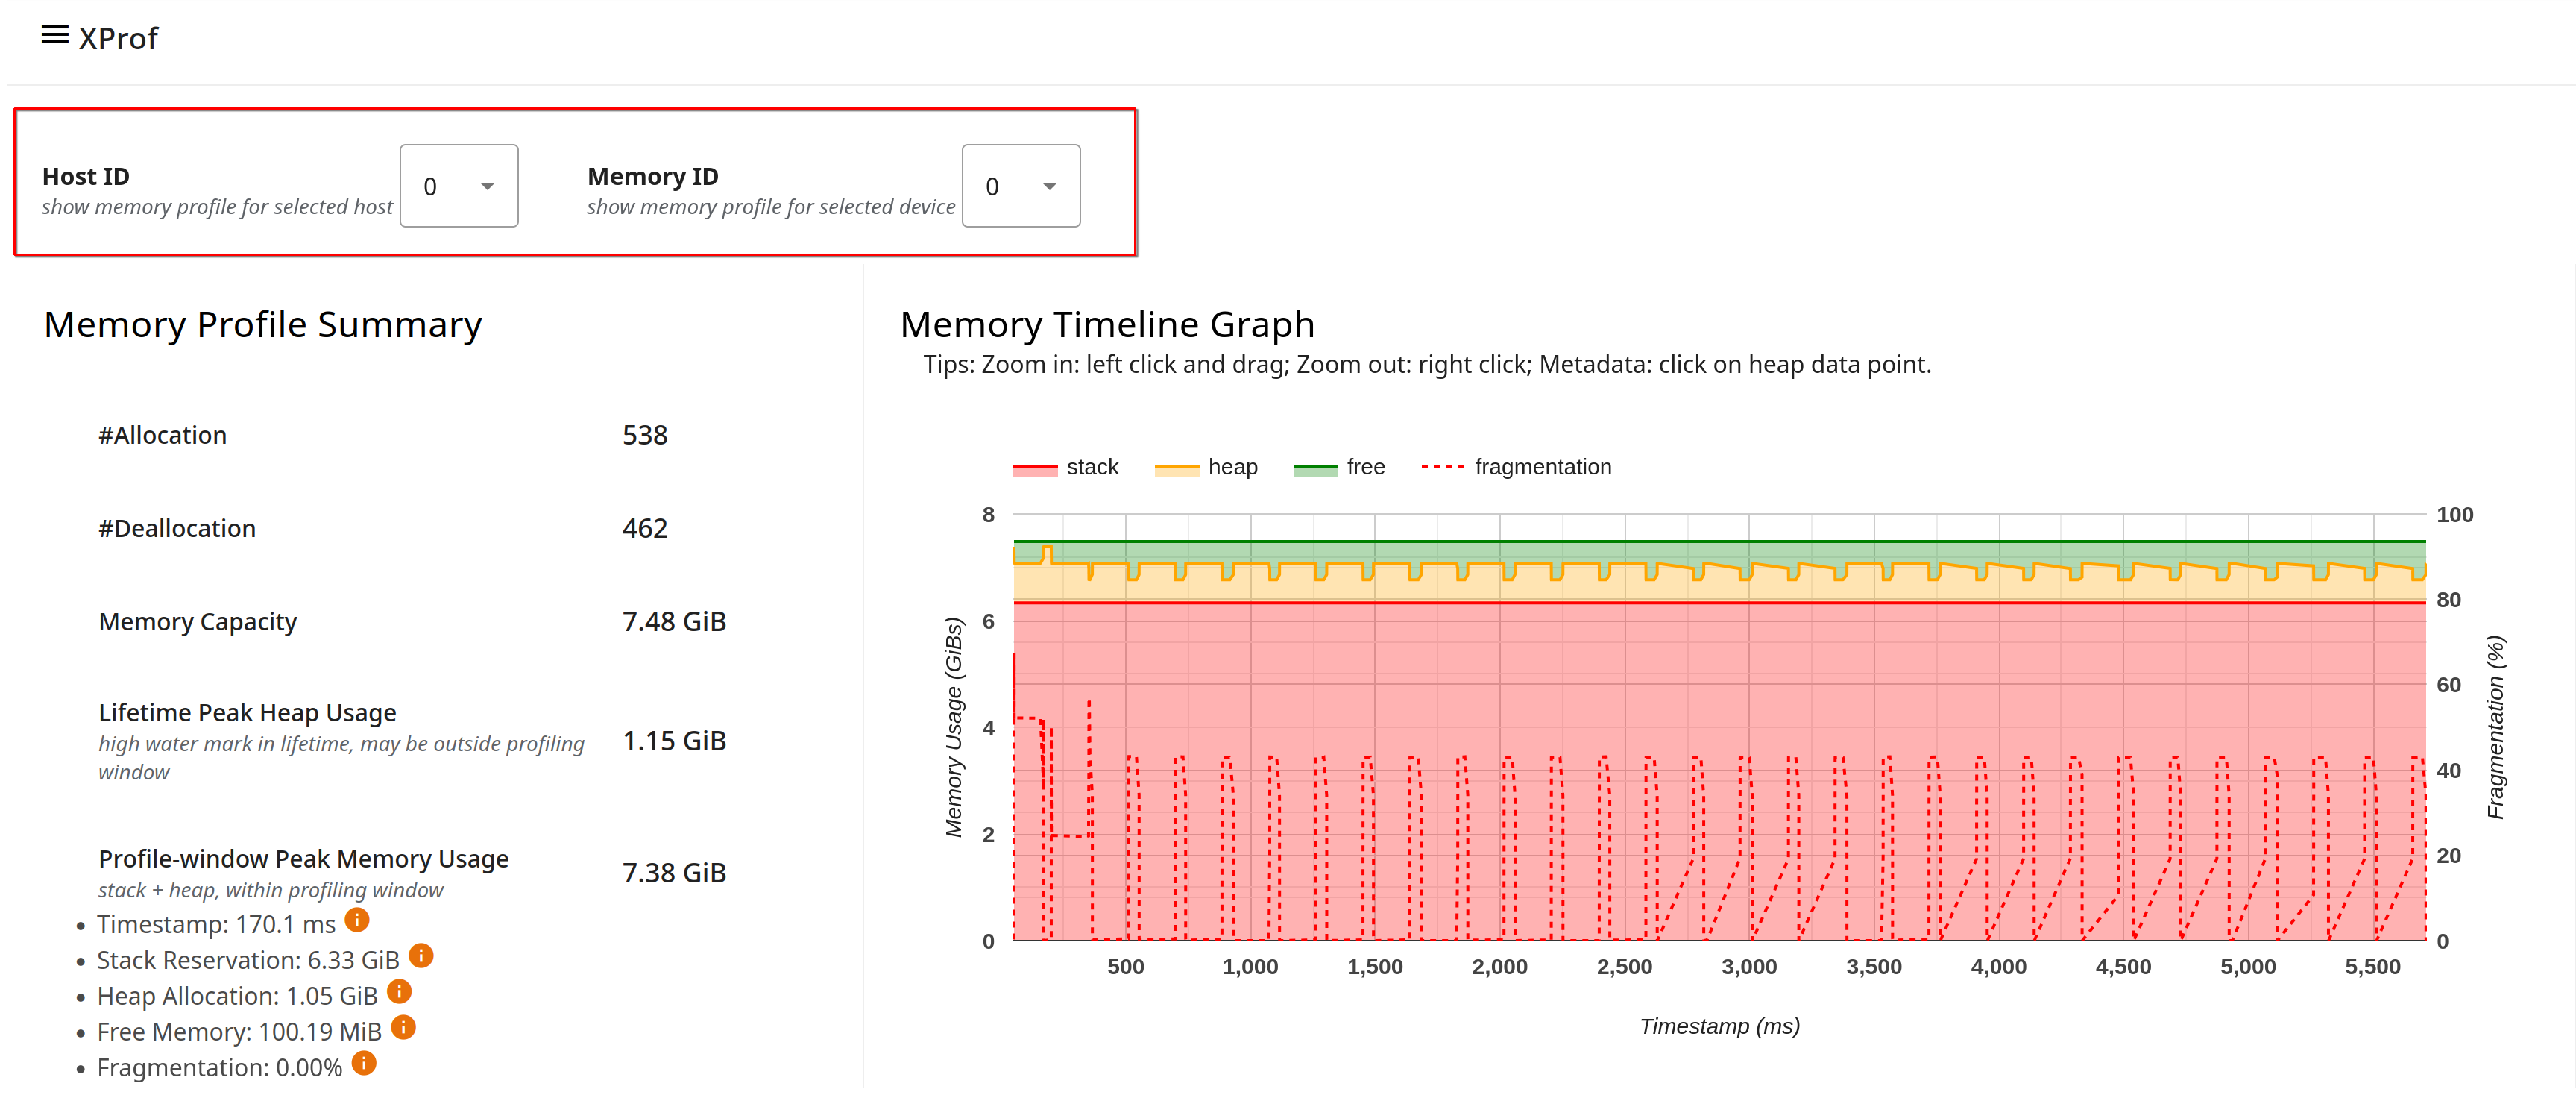
The Memory Profile Summary and the Memory Timeline Graph capture high-level information about memory allocations, deallocations, and usage during the profiling session, including breakdowns across stack and heap, and any impact of fragmentation.
The Memory Profile Summary shows the total number of allocations and deallocations during the profiling interval; the total memory capacity of the memory system selected; the lifetime peak heap usage since the model started running (note that this may be outside the profiling interval); and the peak memory usage within the profiling interval.
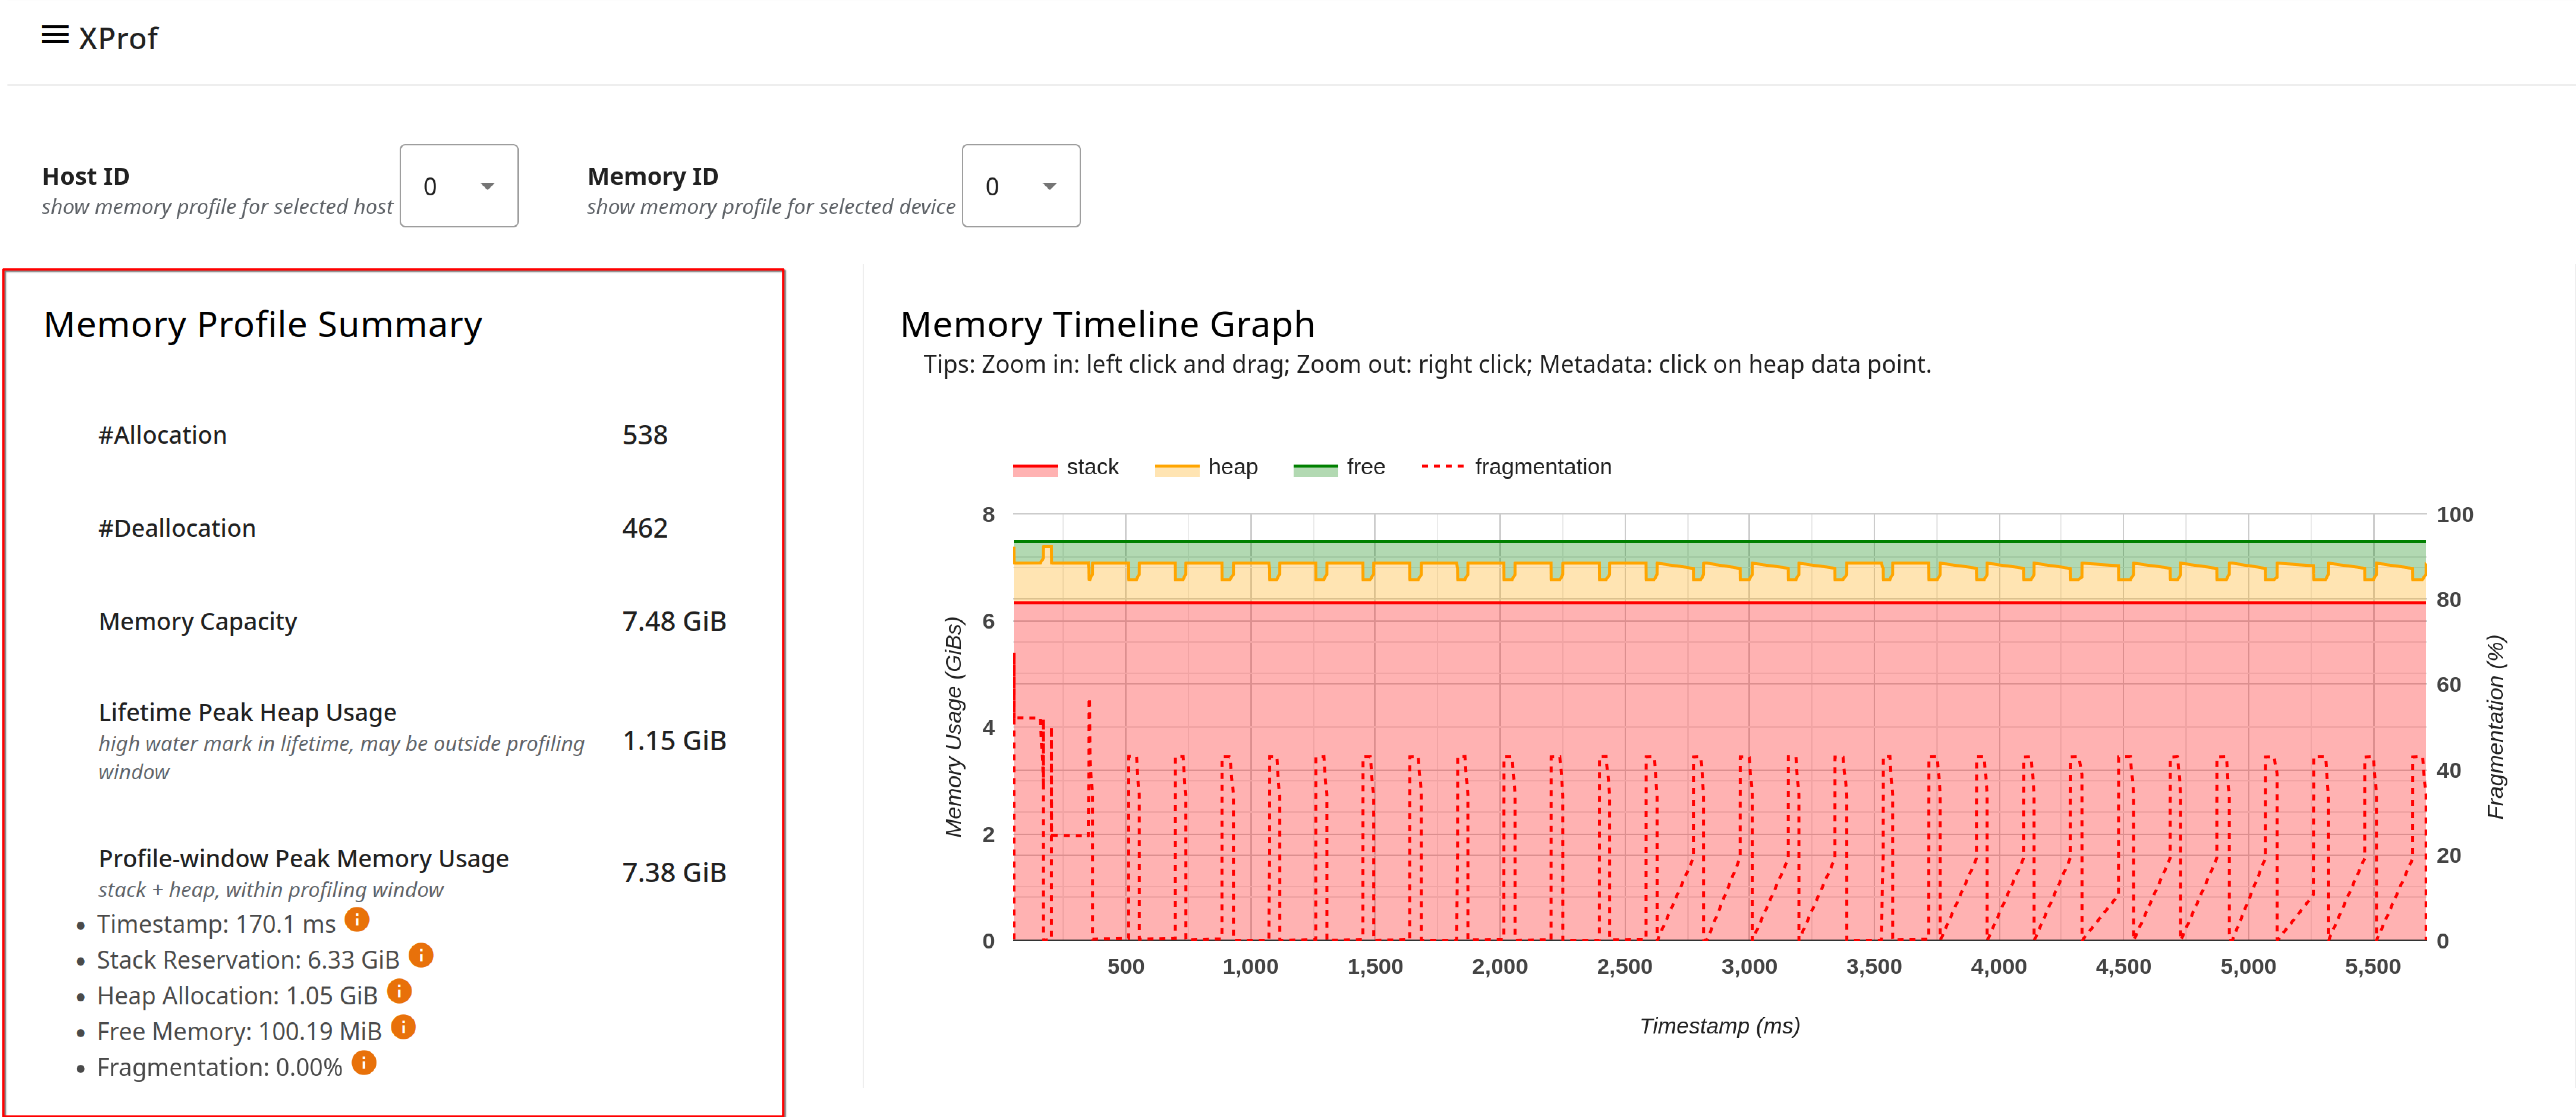
The Memory Timeline Graph shows a plot of the memory usage over time (represented by the Y-axis on the left of the graph) and the percentage of fragmentation over the profiling interval (represented by the Y-axis on the right of the graph). At each point in time on the X-axis, the total memory is broken down into three categories: stack (in red), heap (in orange), and free (in green). Hover over a specific timestamp to view the details about the memory allocation/deallocation events at that point like below:

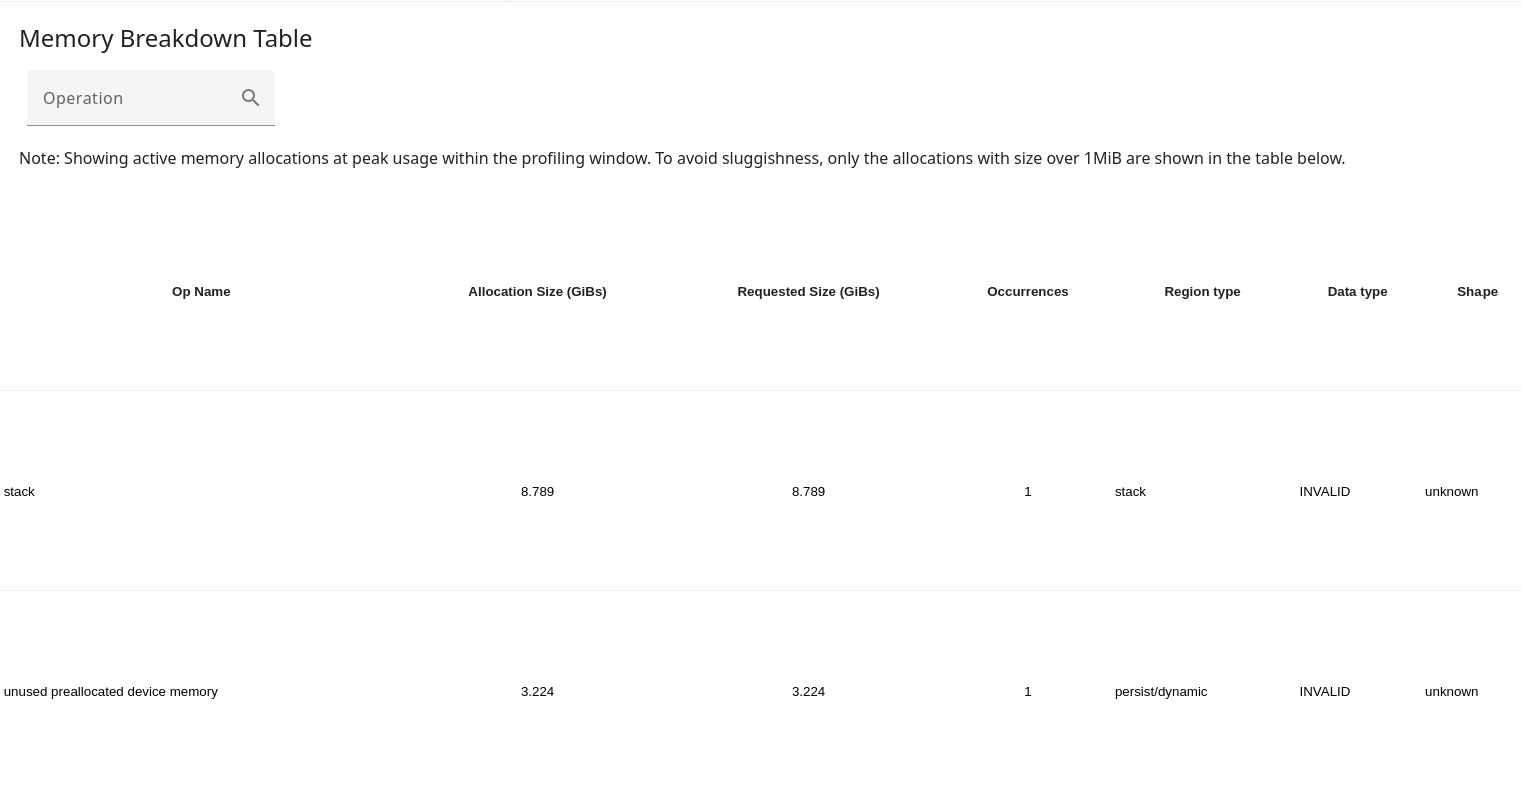
The Memory Breakdown Table provides information about framework-level ops that contribute the most to memory usage. There are also additional per-op details such as the shape, data type, etc., if this information is made available by the compiler to XProf. The table shows these details at the point of peak usage within the profiling window, to aid with debugging Out of Memory (OOM) situations.
Allocations and deallocations are managed (and added to the profile) by XLA’s runtime allocator, which owns the entire HBM memory space.
The fragmentation metric in the memory profile summary and the memory timeline graph (as a percentage) help identify memory fragmentation issues. A high fragmentation value indicates that although there might be enough total free memory, it is not contiguous, and thus a large allocation request might fail.
Note that Memory Profile is typically more interesting and valuable for GPU profiling than for TPU workloads. The TPU execution model typically involves a large upfront allocation by the XLA compiler, rather than during model training or inference. Therefore, you will often see that the allocation chart looks like a flat horizontal line; the allocations all likely occurred at the very beginning of the profile (if the profiler was active by that point in the run), making them hard to see.
Some key differences between this tool and the Memory Viewer tool:
- Memory Viewer is purely static and focuses on program order; Memory Profile provides a dynamic view over time during the profiling interval.
- Memory Viewer visualizes memory allocations on a per-XLA-module basis; for workloads consisting of multiple XLA modules, Memory Profile provides a global view of memory.