
Megascale Stats Tool
You can use the Megascale Stats tool to analyze inter-slice communication performance of workloads spanning multiple TPU slices that communicate across the Data Center Network (DCN).
All metrics displayed in the Megascale Stats tool are generated on a per-TPU basis.
Supported Platforms
The Megascale Stats tool is only supported on TPUs.
Terminology Related to Collectives
The tool displays metrics related to communication between TPU slices, which involve the following operations:
send: Interrupts the host to start Direct Memory Access (DMA) and provides a filled buffer to the host to start data transfer.send-done: Signals the host that the data transfer is completed.recv: Provides an empty buffer for the host to fill with the transferred data.recv-done: Signals the host that the data has been received.
A collective is initiated by a send operation and completed by the
matching recv-done operation. The actual sending of data occurs after the send
operation is completed. The send-done operation occurs after the data has been
sent. Likewise, data is received after the recv operation is completed. The
recv-done operation occurs after the data is received.
Interface Components
The tool displays a table with the following columns, with one row for each profiled collective operation:
- DCN collective name: Assigned by XLA.
- Recv op name: The TPU
recv-doneoperation name. This provides an easy way to search Trace Viewer for the corresponding collective TPU operations. - Send op name: The TPU
sendoperation name. - Slack time: Defined as the network independent time the collective has to
transmit the data. It is a measure of the time the collective has available
to send and receive data, excluding the
send,send-done,recv, orrecv-doneoperations. Increasing slack time reduces the chances of stalling the TPU for a collective. For example, given the following timeline:
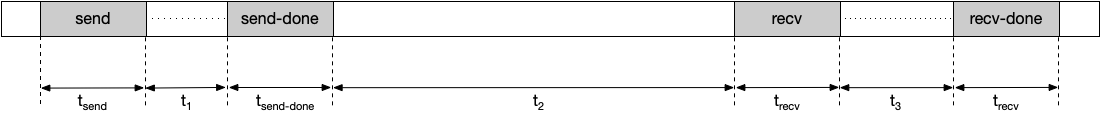
Slack time is calculated in this example as:

Slack time = t<sub>1</sub> + t<sub>2</sub> + t<sub>3</sub>
- Observed duration: The duration observed for each collective. It is computed
as the interval between the start of the
sendoperation to the end of the correspondingrecv-doneoperation, including the time spent sending and receiving data. For example, given the following timeline:

Observed duration is calculated as:

Observed duration = t<sub>send</sub> + t<sub>1</sub> + t<sub>send-done</sub> + t<sub>2</sub> + t<sub>recv</sub> + t<sub>3</sub> + t<sub>recv-done</sub>
- Stall Duration: The duration of time the collective stalls the TPU. This is
the total duration of time the collective spends in the
send,send-done,recv, andrecv-doneoperations, not including the time spent transmitting data. For example, given the following timeline:

Stall duration is calculated in this example as:

Stall duration = t<sub>send</sub> + t<sub>send-done</sub> + t<sub>recv</sub> + t<sub>recv-done</sub>
- Occurrences: The total number of times a collective is initiated and
completed during a profile duration. The
sendoperation and its matchingrecv-doneoperation must occur within the profile duration to be included in this metric. - Aggregated total stall: The total amount of time a collective stalls a TPU
during a profile duration. Aggregation total stall is calculated as:
- Aggregated total stall = stall duration * occurrences
- Data transmitted size: The amount of data that is transmitted over the network for the collective, computed based on the XLA operation shape.
- Required bandwidth: The bandwidth required to transmit the data within the
provided slack. You can use this metric to see the number of collectives
competing for network bandwidth during the profile duration. Required
bandwidth is computed as:
- Required bandwidth = data transmitted size / slack time
Analyzing Megascale Stats Tool Data
To analyze the data presented in the tool:
- Sort the table by
Aggregated Total Stallin descending order. - Identify the DCN collective name with the highest
Aggregated Total Stall. A significantly high value compared to others may indicate a bottleneck. - Multiply the
Required Bandwidthof the DCN collective by the number of cores (e.g., 8 per v4 TPU host). If this value is greater than the maximum network bandwidth of the TPU, it may indicate network congestion. Try changing the sharding mechanism to reduce the required bandwidth. - Generate an HLO dump to check for compiler issues. Fanning out
sendandrecv-doneoperations can allow for scheduling more overlapping HLO operations and reduce TPU stall time. - Check the duration of
recv-doneoperations in Trace Viewer for the collective with the maximum aggregated total stall. A high transfer duration could indicate a bandwidth bottleneck asrecv-doneoperations are usually blocked on the network. - If the duration of
recv-doneoperations is not excessively high compared to the slack time, it might suggest a hardware issue.