Memory Viewer Tool
You can use Memory Viewer to visualize memory usage over the program's lifetime. You can dive into the details of the contents of memory at the point of peak memory usage, including to debug Out Of Memory (OOM) situations. Memory Viewer can help you see the global memory usage and how close the computation is to being out of memory.
All information displayed in Memory Viewer is purely static, obtained from the XLA compiler; dynamic runtime information is presented in the Memory Profile tool.
Supported Platforms
Both TPU and GPU are supported.
Memory Viewer Components
The Memory Viewer tool consists of several key components:
User control dropdowns that let you customize the data that you’re visualizing:
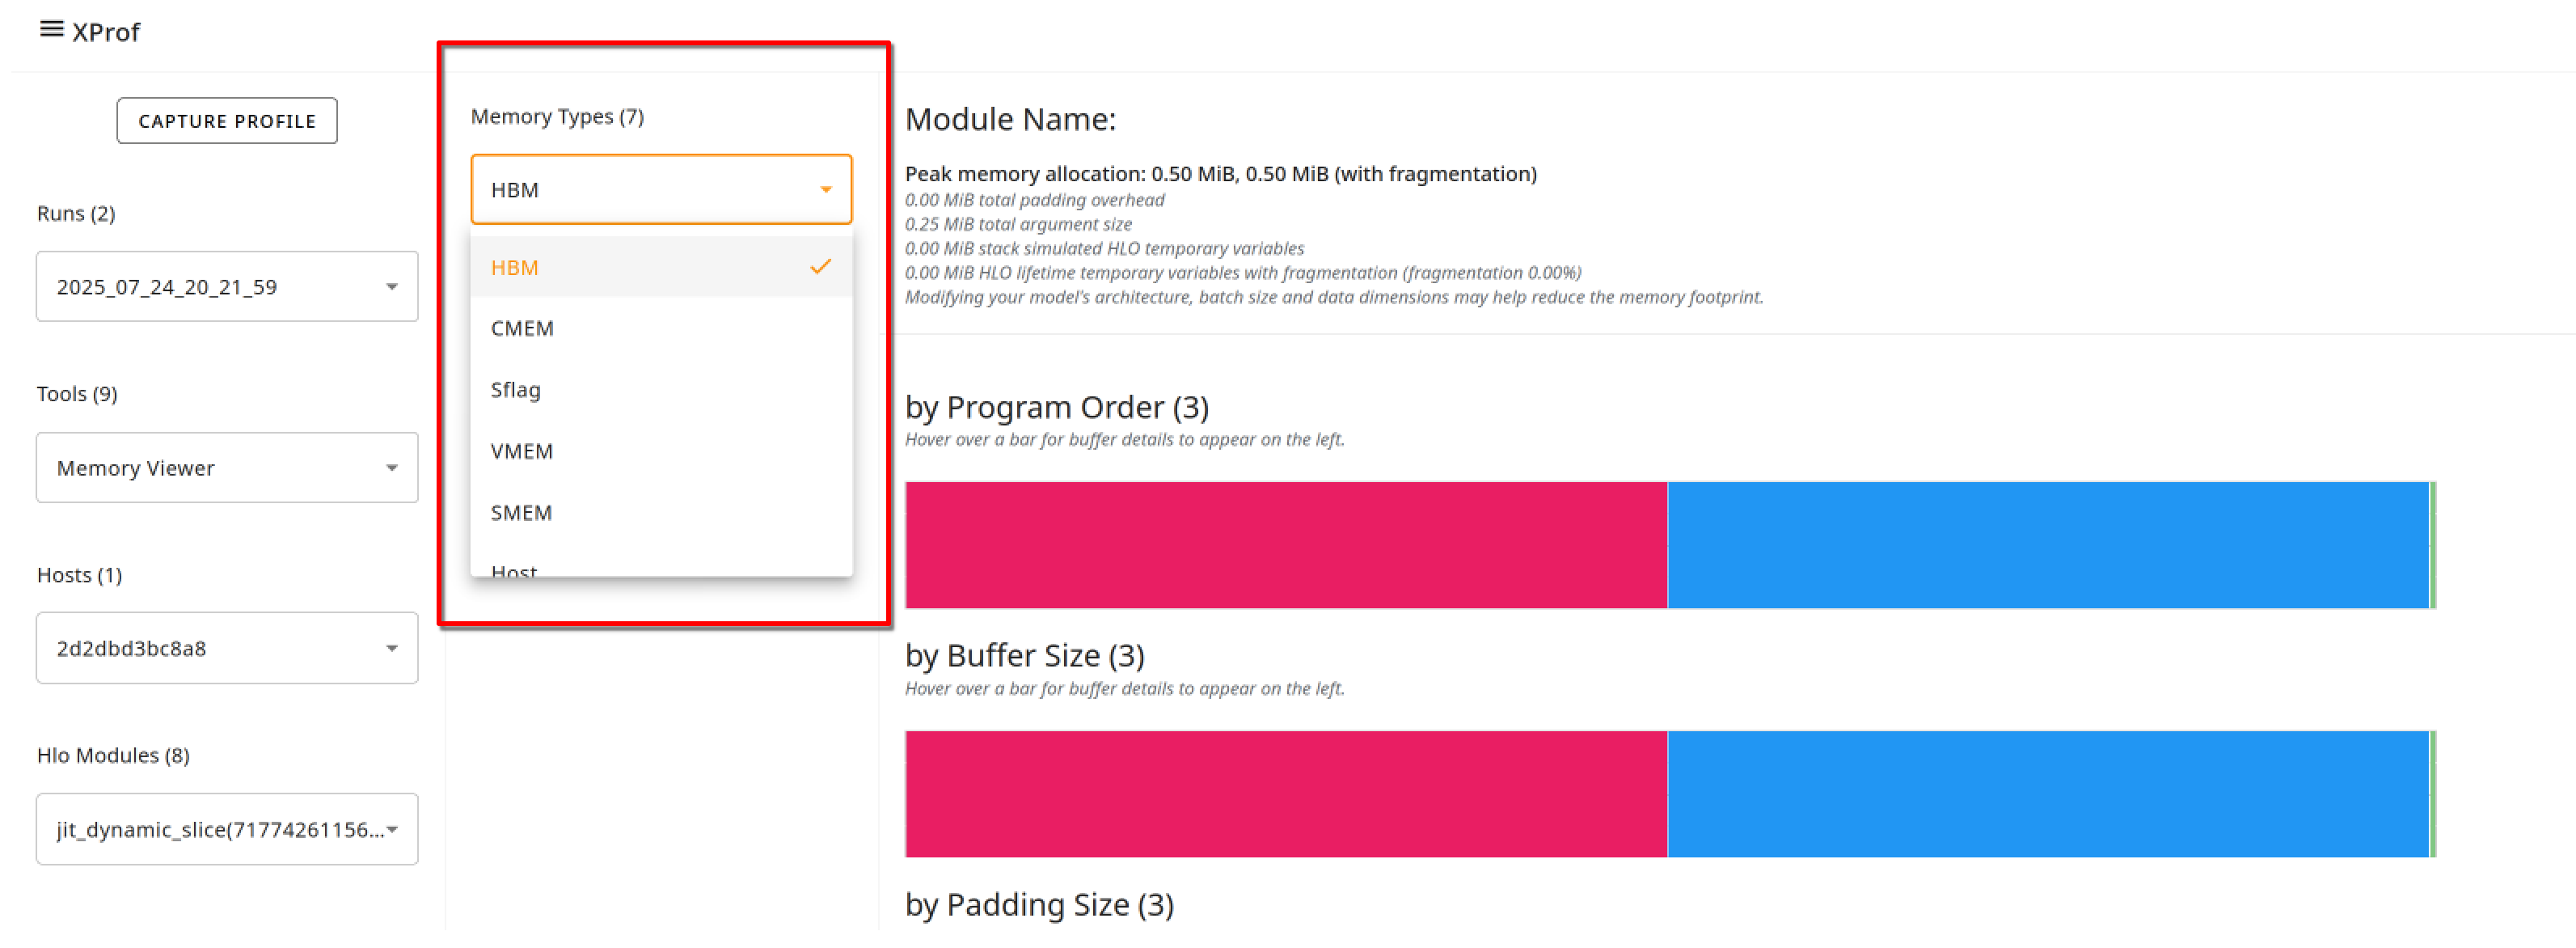
Memory types: The supported memory types are accelerator-dependent. For GPUs, the focus is on the High Bandwidth Memory (HBM) and Host Memory, whereas for TPUs, you can additionally view usage for on-chip memories including VMEM, SMEM, CMEM, Sync Flags (SFlag), Sparsecore, and also the Host memory.
HLO Modules: These are the XLA programs that were part of your execution. A good starting point is often a top-level module, labeled something like
jit_train_steporjit_generate. This dropdown appears at the left panel.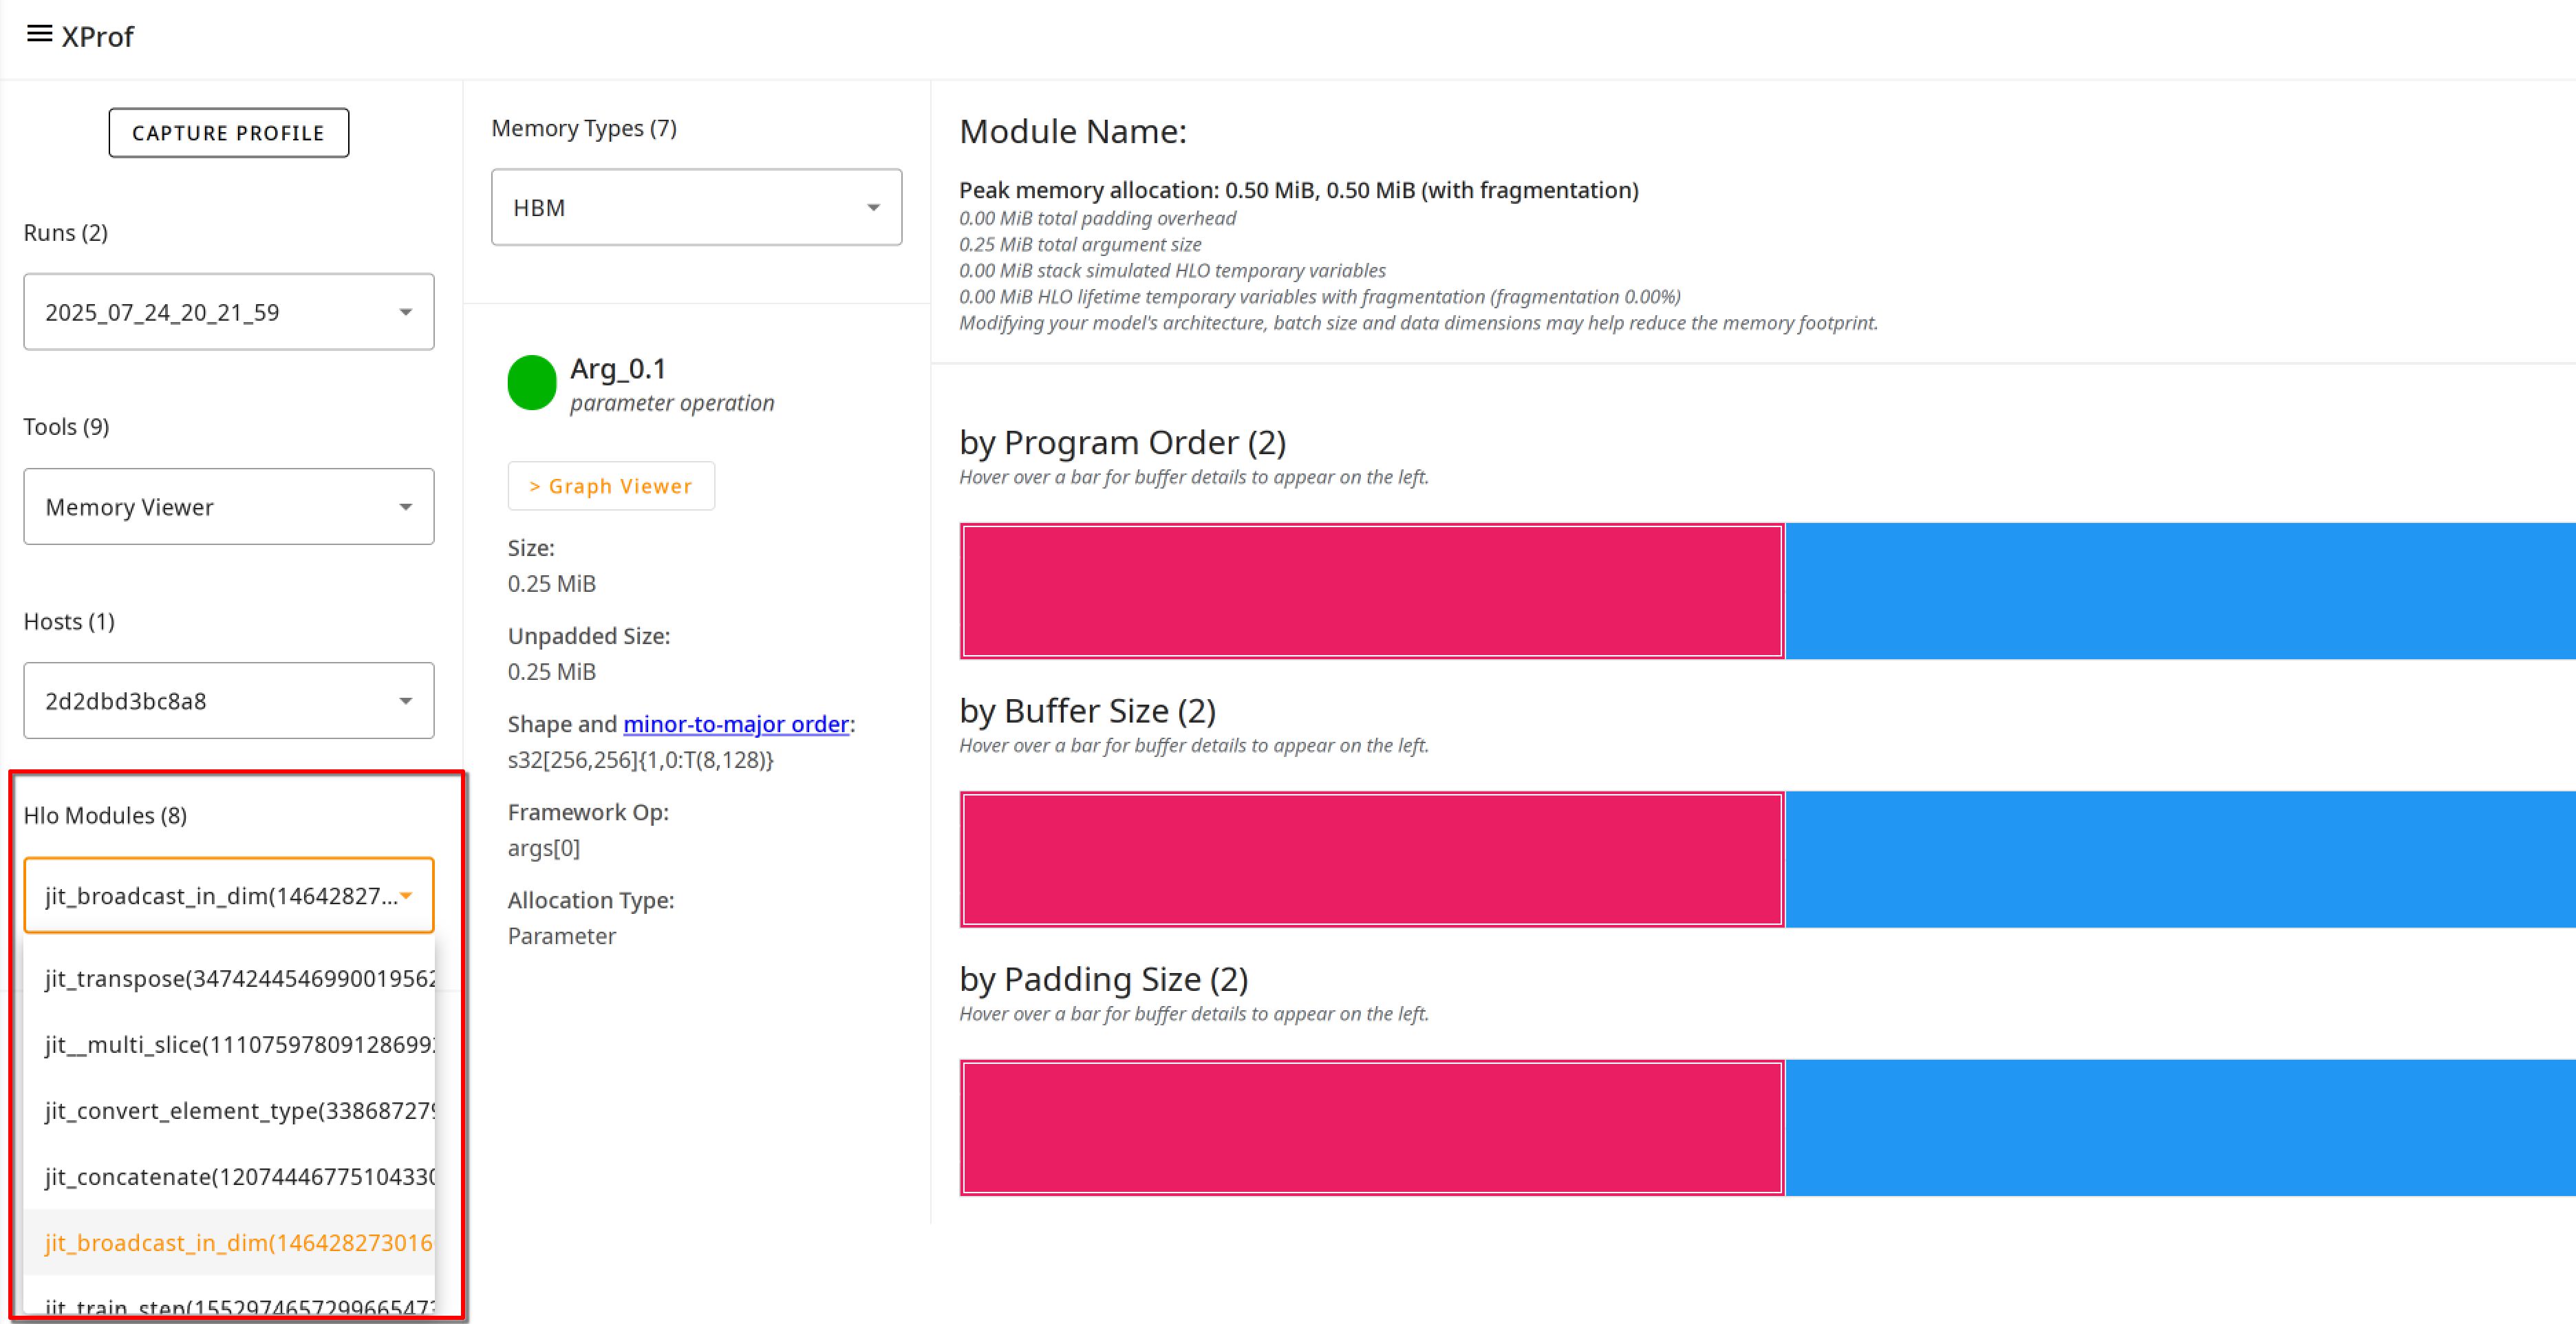
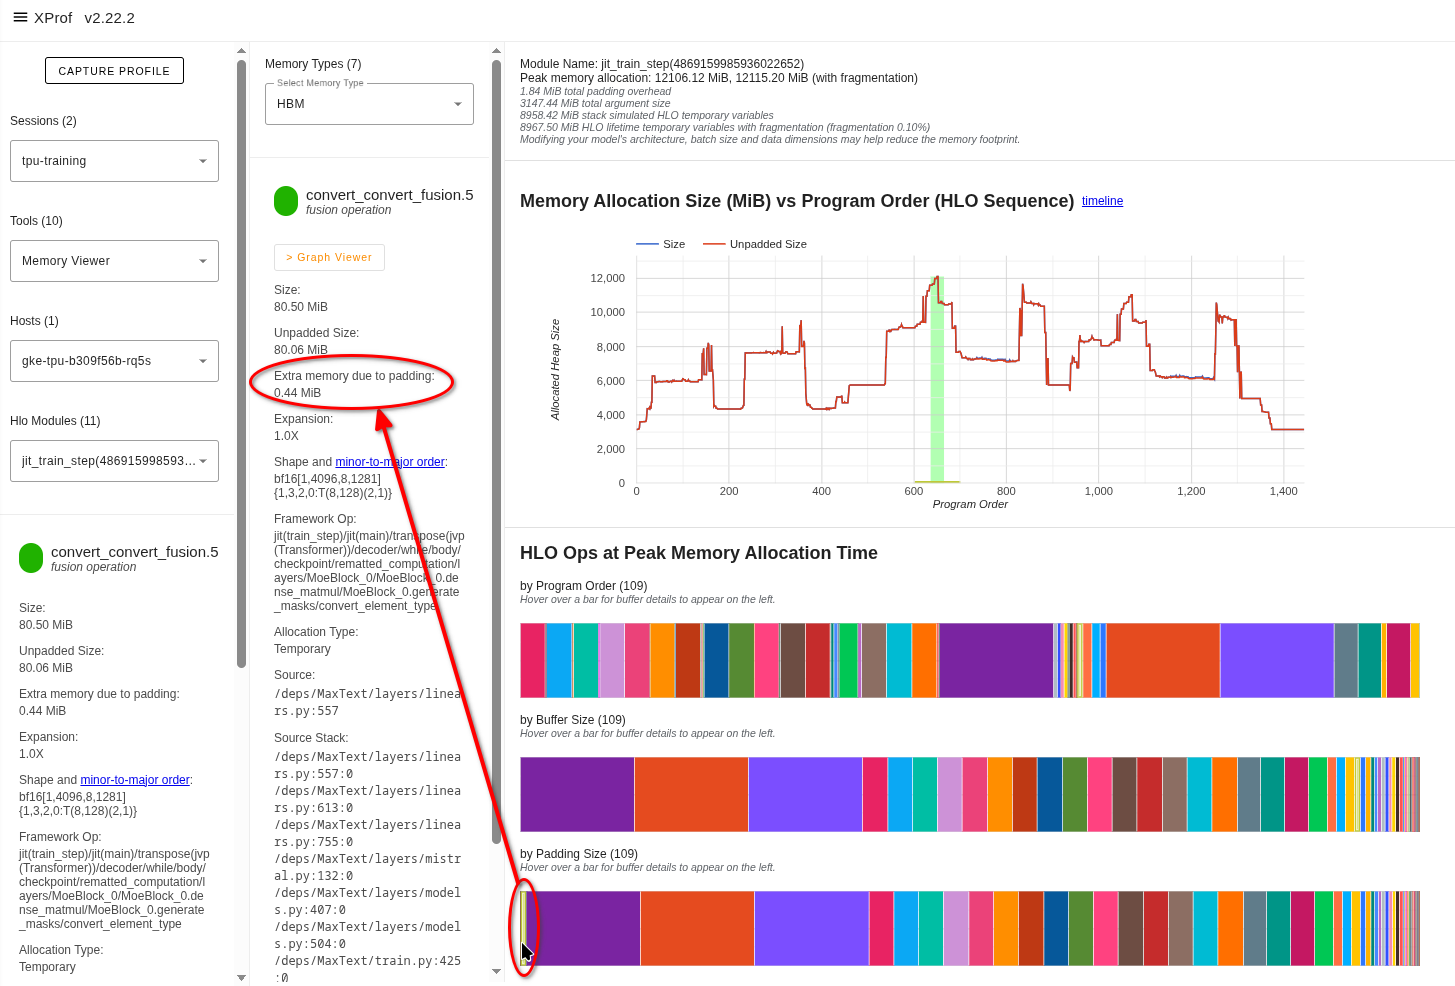
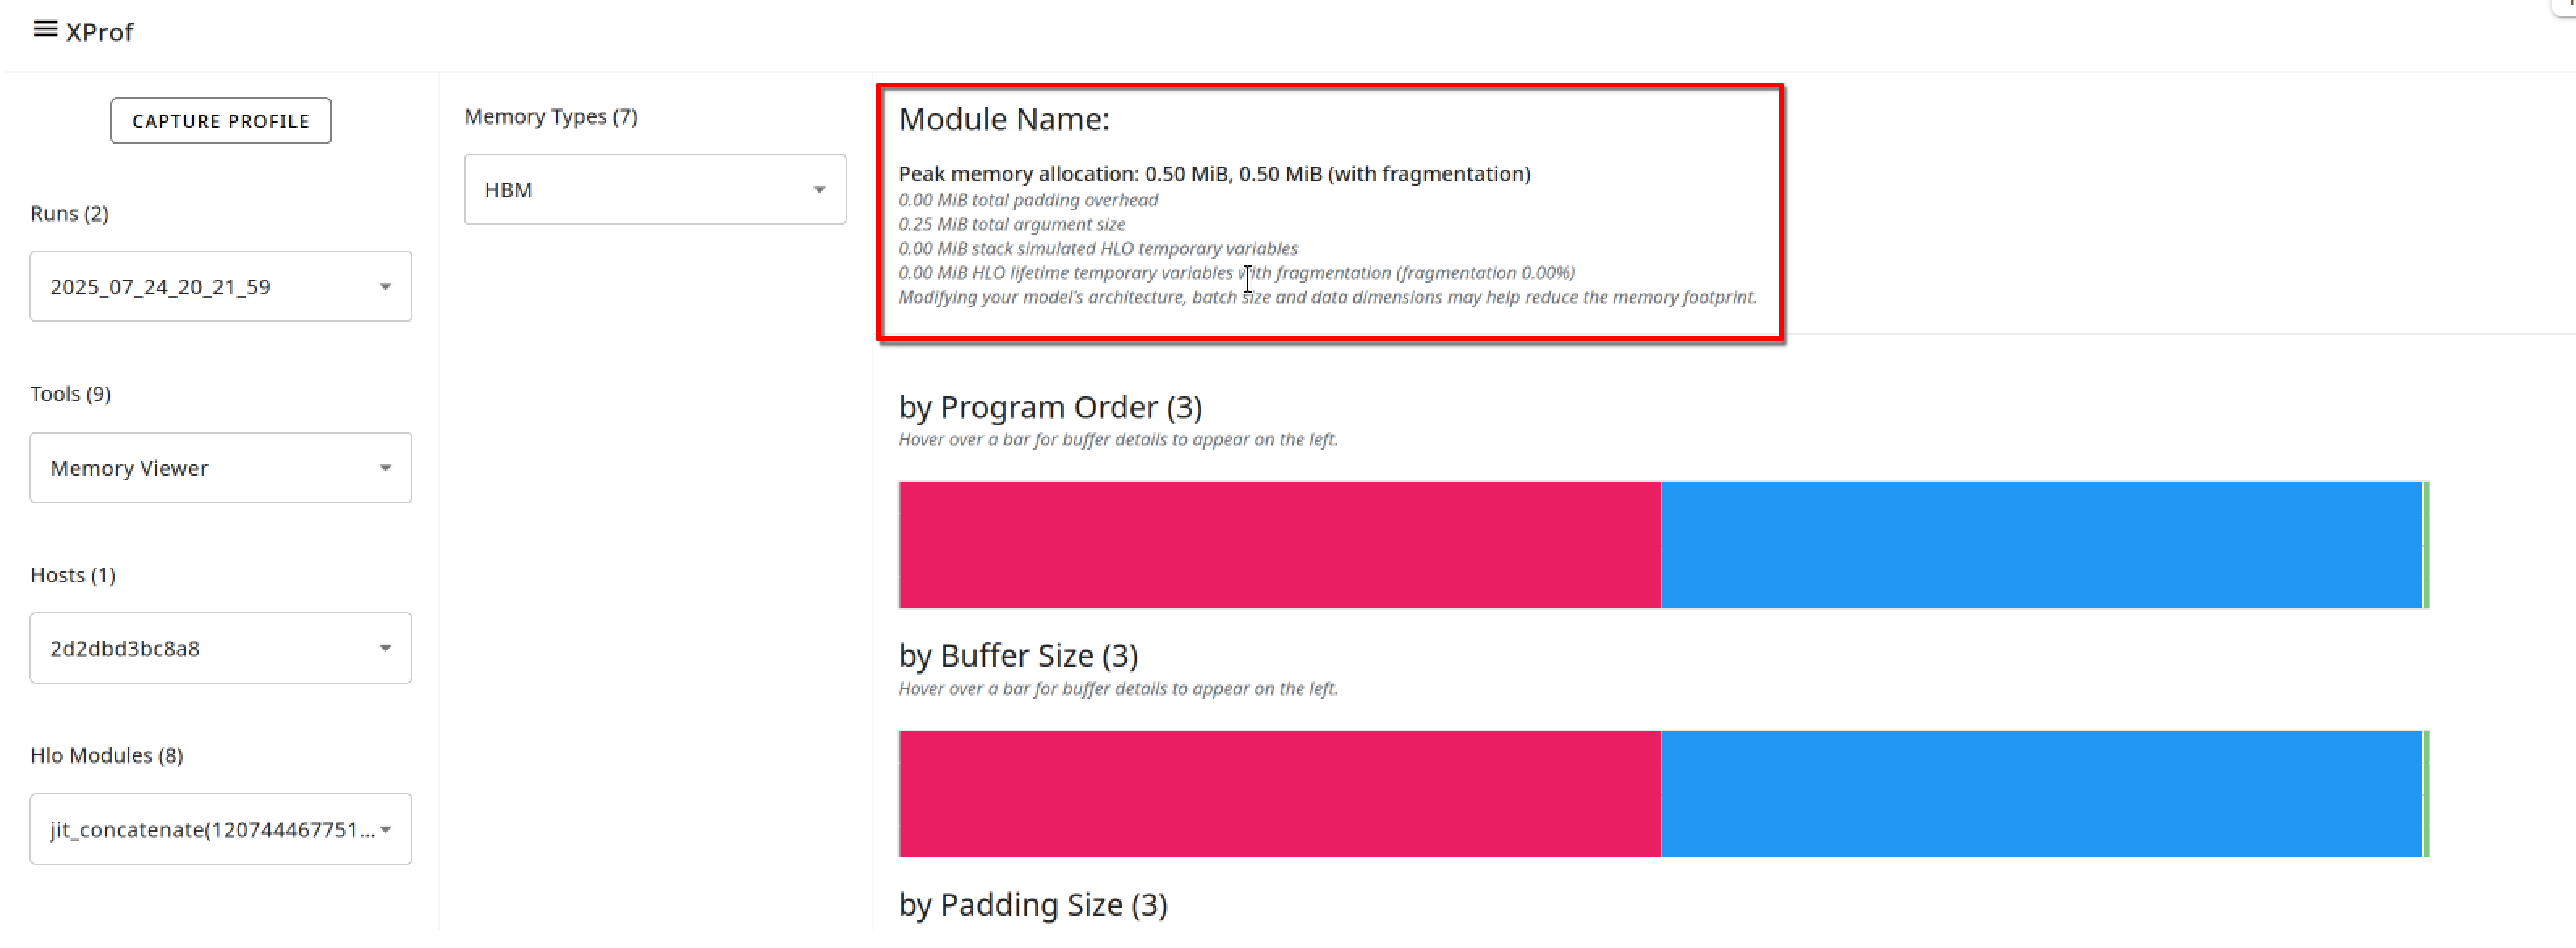
The textual overview section provides high level information such as the peak memory allocation required for the program, the split between arguments vs. temporary variables, etc. There is overhead imposed by padding, necessitated by restrictions on the supported shapes of tensors on accelerators. If this padding is a large fraction of the total allocation, that may indicate an optimization opportunity.
The Memory Allocation Size vs. Program Order line chart plots memory usage versus program points (HLO Sequence) as scheduled by the compiler.
- Note that the x-axis is not time.
- The chart specifically highlights the point in the program with peak memory utilization of the chosen module. The profiler and tools are unaware of the co-residence of modules on a given chip/memory. When each module is compiled, the compiler annotates the profile with the “baseline” starting point of the total allocated memory (by modules that were compiled prior to this one), and counts up and down from there as further allocations and deallocations occur. However, any future allocations by other modules compiled prior to execution are not captured; keep this in mind while debugging OOM situations.
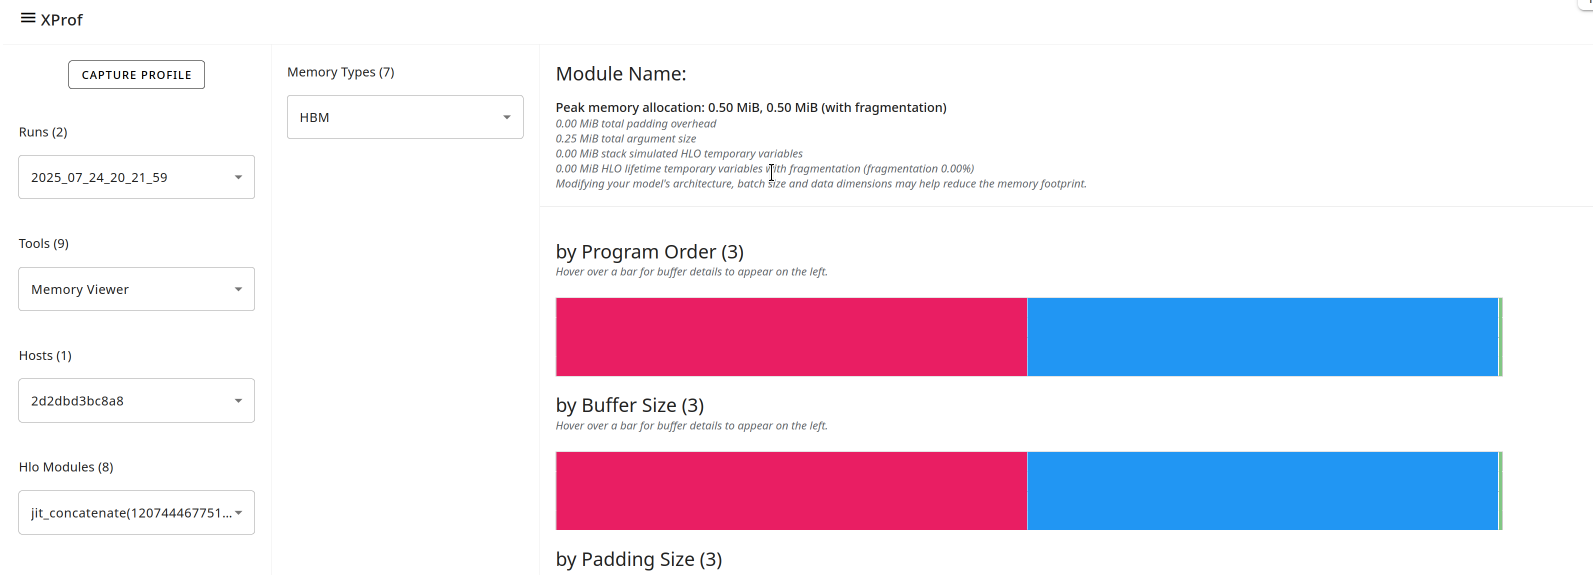
Buffer charts at the bottom of the page break down memory usage at the peak usage program point (indicated by the vertical line in the memory usage line chart). There are three charts, all showing the entire set of buffers allocated by the program, but sorted three different ways:
- By program order: the order they came to life during program execution, with the oldest ones appearing on the left.
- By size: the ones with the largest impact on the peak memory usage point are on the left.
By the padding overhead they impose: the most “inefficient” from a hardware perspective appear on the left.
Note that the colors of the buffers have no particular meaning.
Clicking on the "timeline" link next to the chart title brings up a visualization of the memory allocations, with a series of colored boxes, one per allocation. Hovering over the block brings up additional information about the allocation; for example, the HLO op that created the allocation, the shape of the allocation, etc. The visualization may be interpreted as follows:
- The x-axis is the program order.
- The height of each block on the y-axis is the size of the allocation.
- The width of each block is the lifetime of the allocation, in terms of program order.
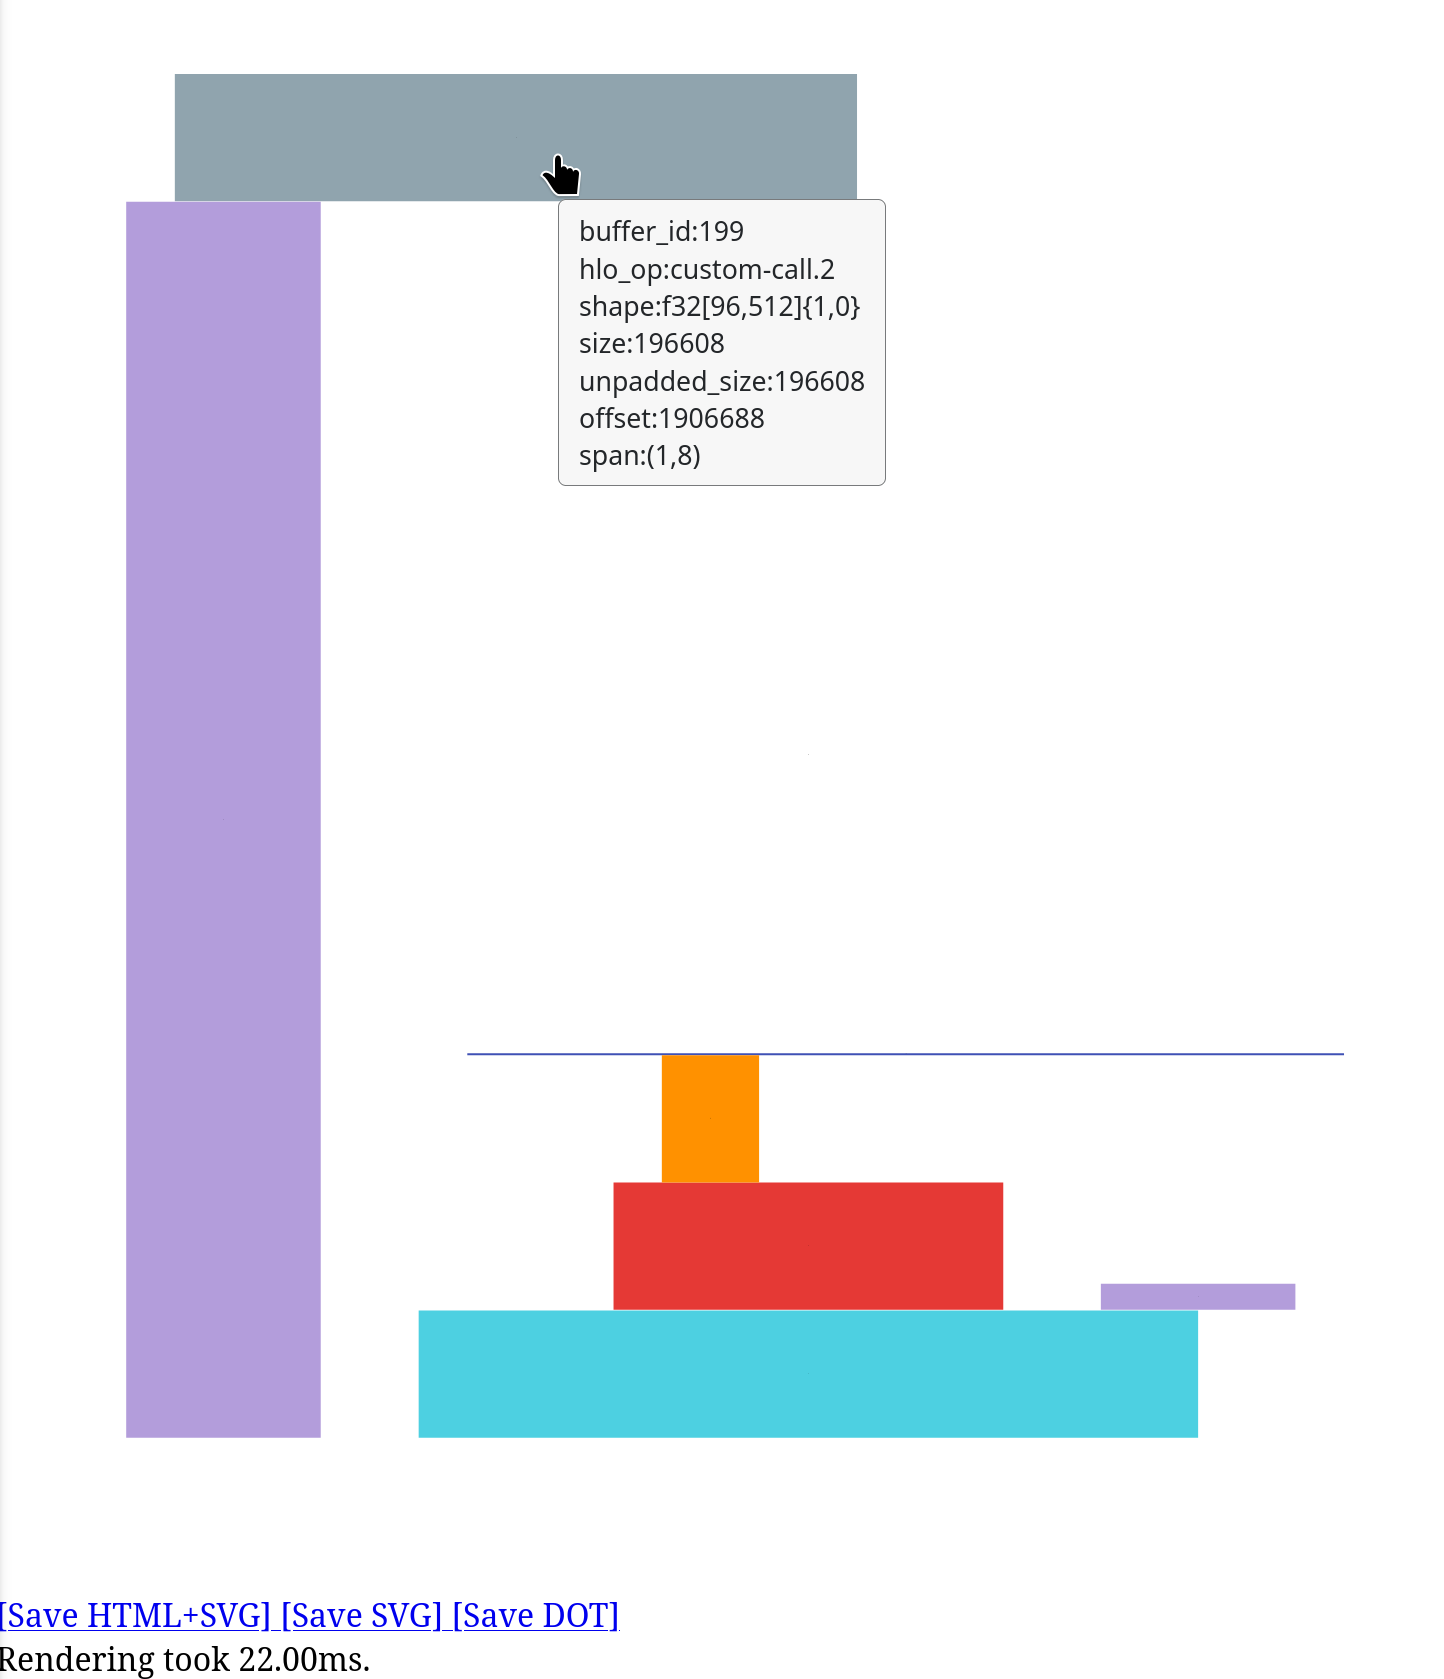
The timeline can also be saved as an SVG, DOT or HTML+SVG file.
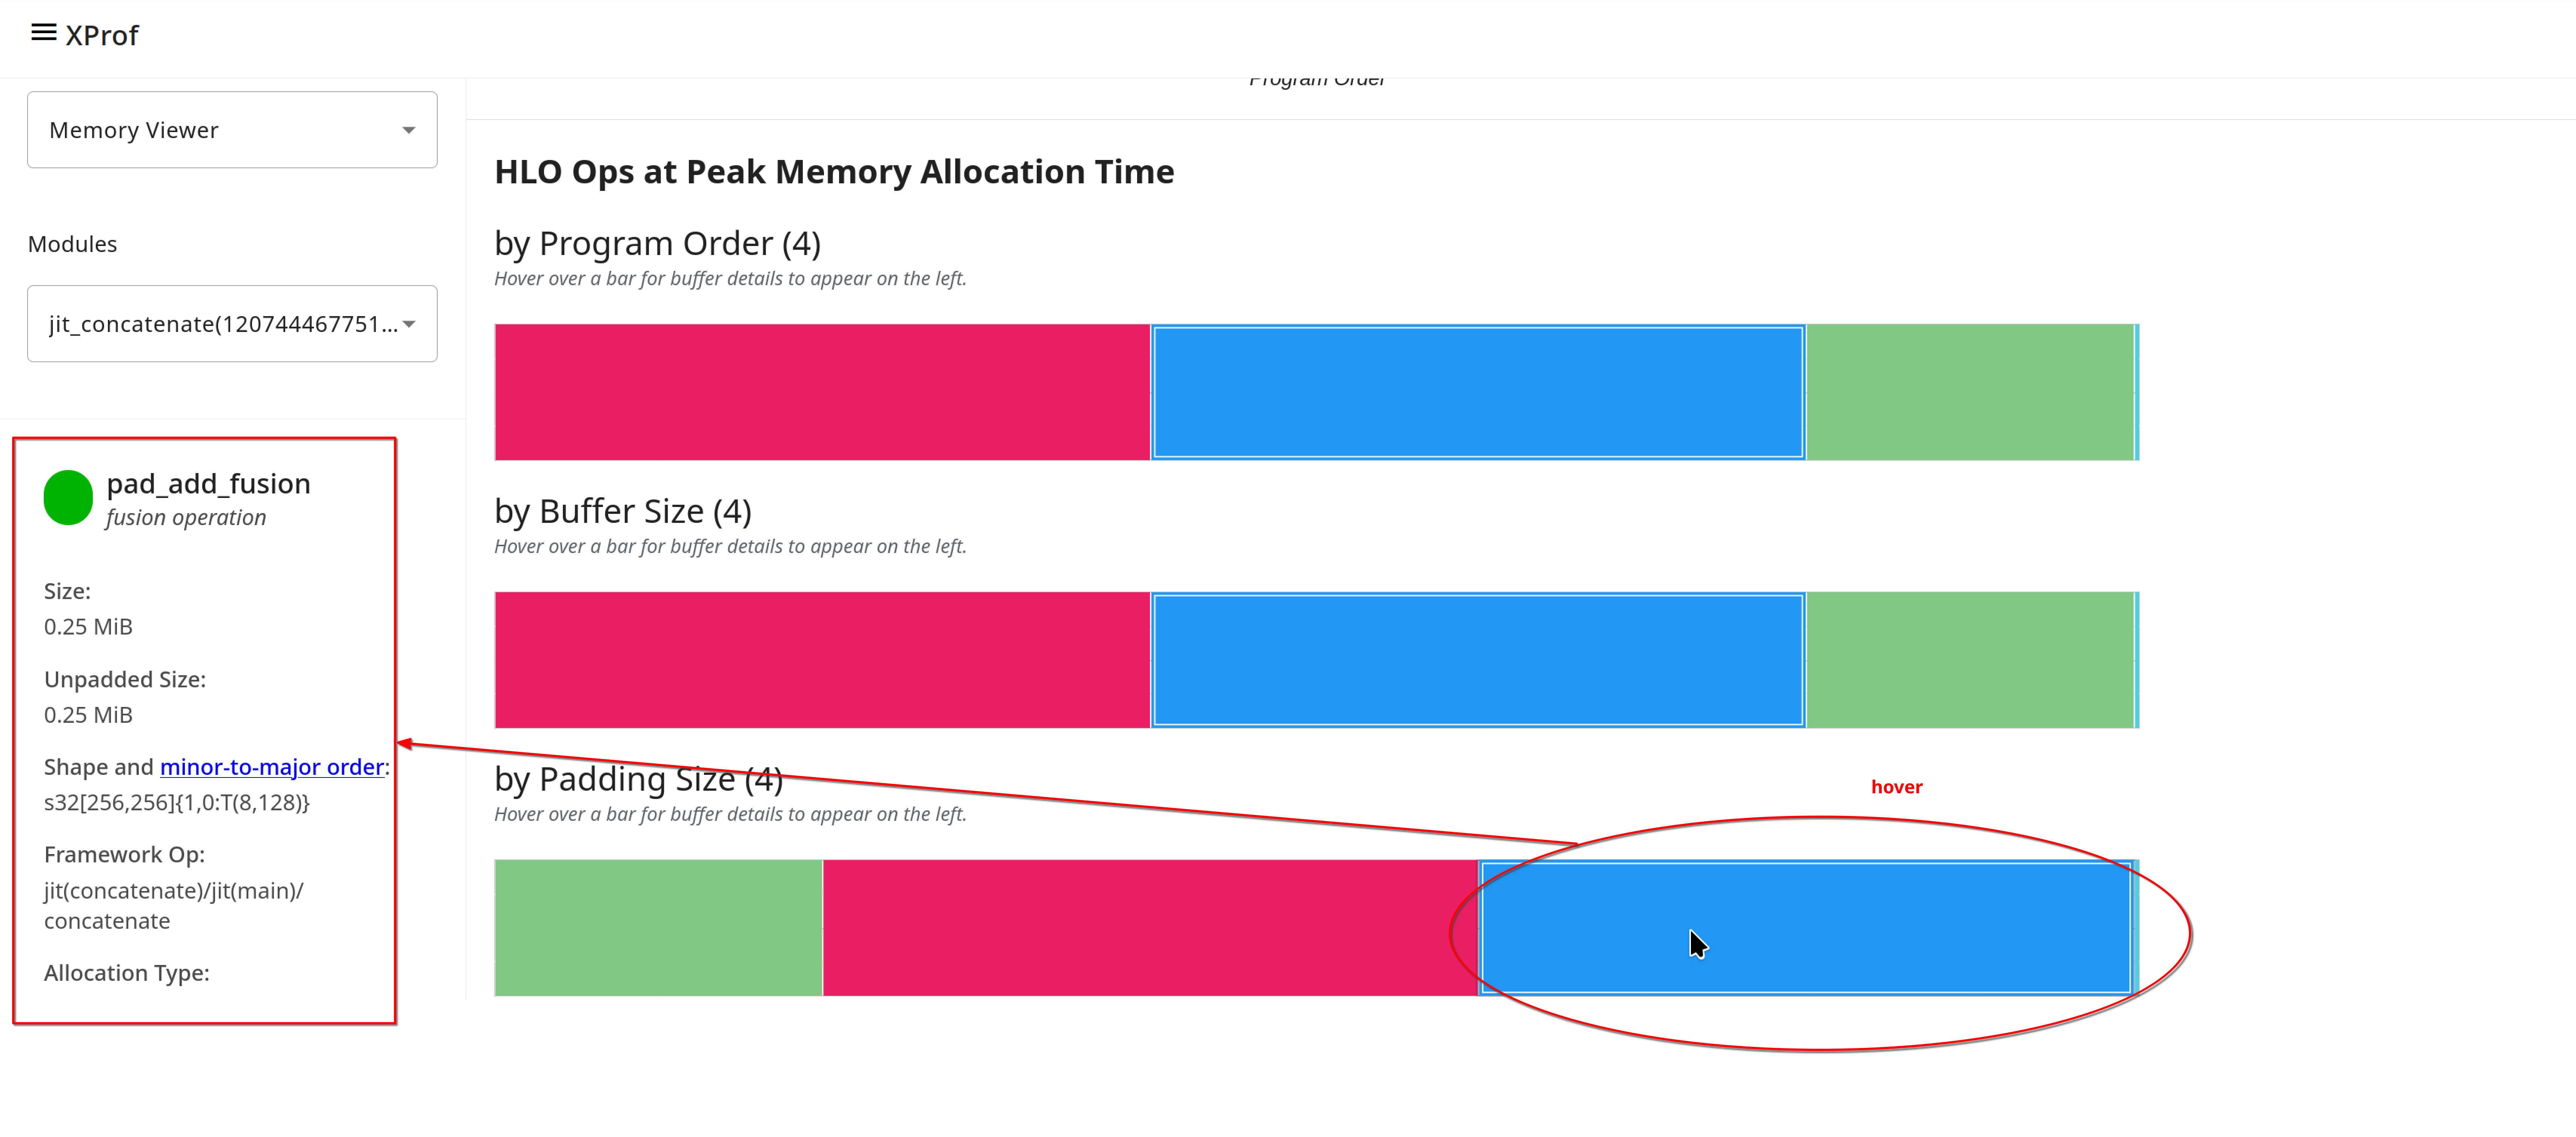
Hovering over a buffer in any of the three charts brings up two additional displays:
- An overlay on the memory usage line chart in a color that matches the buffer card, indicating the lifetime of that buffer; i.e., a horizontal bar whose left and right edges indicate the allocation and deallocation points, within the program order. The height of the horizontal bar represents the relative size of the selected buffer compared to the peak allocation.
A separate buffer details card, typically on the left side, with details about the specific op as applicable. A typical card includes the following information:
- Name: The XLA operation name, that you can search for in Graph Viewer or Trace Viewer.
- Size: The size of the buffer allocation, with and without padding.
- Shape: Describes the rank, size, and data type of the N-dimensional array.
- Framework op name: Shows the framework operation name associated with this allocation.
- Allocation type: Categorizes the buffer allocations into the following types: Parameter, Output, Thread-local, and Temporary (e.g., buffer allocation inside a fusion).
- Source: Shows the source code location (file and line number) for the operation that created the buffer.
- Source Stack: Displays the full call stack for the operation, providing the execution context that led to the buffer allocation.
How to interpret the Memory Viewer Buffer Charts
The buffer charts at the bottom of the Memory Viewer page are helpful for understanding the composition of memory usage at the point of peak memory usage, and for identifying potential optimization opportunities. Here are some tips for interpreting these charts:
- Look for large buffers: Buffers that are significantly larger than others may be good candidates for optimization, such as by changing the algorithm to use less memory, or by using a more memory-efficient data type.
- Look for buffers with high padding overhead: Buffers that have a large difference between their size with and without padding may indicate an opportunity to optimize the shape of the tensor to reduce padding and improve memory efficiency.
- Look for buffers with long lifetimes: Buffers that are allocated early in the program and deallocated late may be good candidates for optimization, such as by changing the algorithm to reuse memory more effectively or by breaking up the computation into smaller steps to reduce peak memory usage.
In the image below, the chart sorted by Padding Size reveals some extra memory
is being allocated due to padding requirements.