
Overview Page
The overview page provides an aggregated top-level view of how your model performed during a profile run, how well it utilized hardware resources, and where time was spent. The overview page acts as a starting point to pursue more detailed analysis using the other tools within XProf.
Supported Platforms
Both TPU and GPU are supported.
Overview Page Components
The overview page differs between TPU and GPU environments. Here is a breakdown of both variations:
TPU (training)
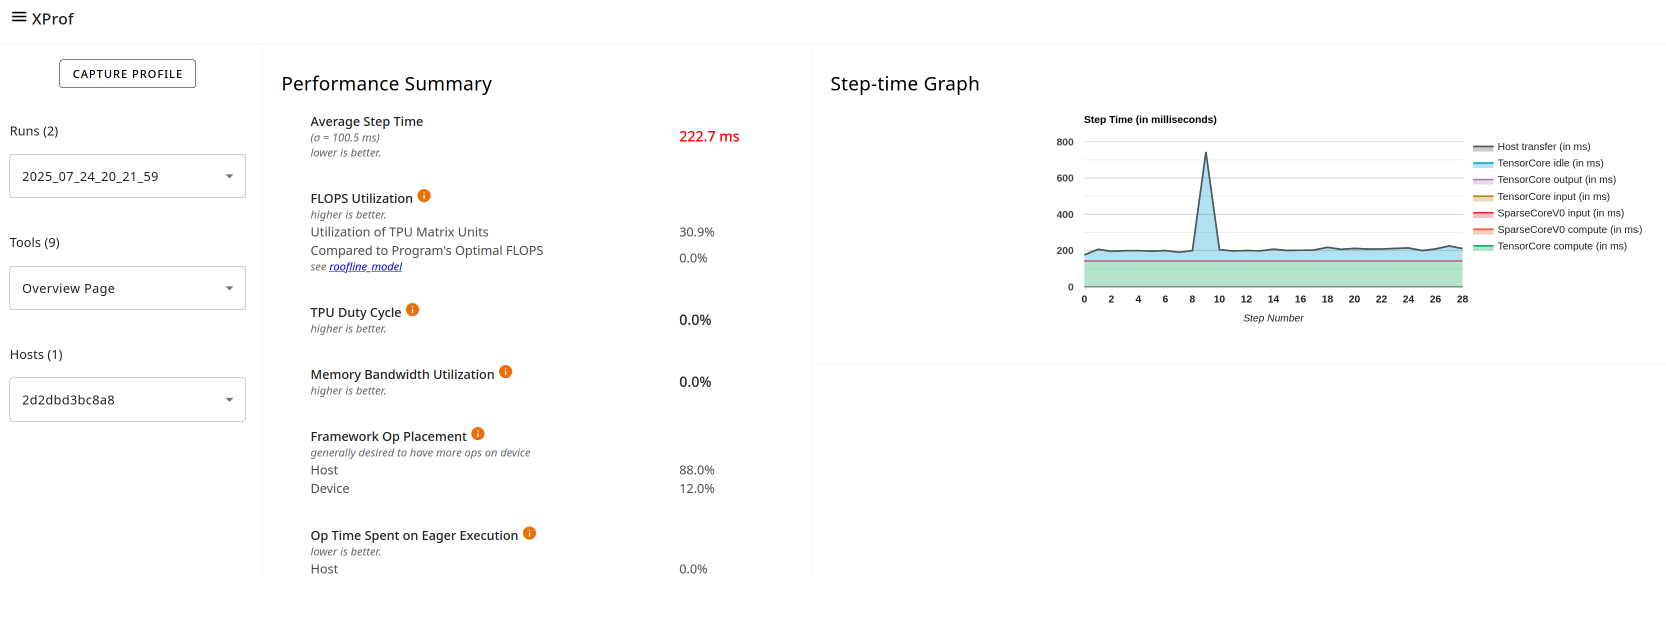
- Performance Summary contains:
- Average Step Time (training only): The step time averaged over all steps sampled.
- FLOPS Utilization
- TPU Duty Cycle
- Memory Bandwidth Utilization
- Program Goodput Efficiency: Measures how your model is performing relative to ideal performance on this hardware.
- TF Op Placement: Whether the op is running on the host or device.
- Op Time Spent on Eager Executions: This metric helps guide potential optimizations related to the eager execution.
- Device Compute Precisions: Reports the percentage of device compute time that uses 16-bit computation and 32-bit computation.
- Step-time Graph (training) plots a graph of step time (in milliseconds) over all the steps sampled. Each of the chart's stacked colors represents a category of step time, such as TensorCore idle time or time spent communicating with the host.
TPU (inference)
For TPU inference jobs, the view is slightly different:
The Step-Time Graph section is replaced by the Inference Session Latency Breakdown section and includes a chart of:
- Inference Session Latency at Percentile: Shows the proportion of the inference job's time spent in host compute, device compute, and host-device communication.
In the Performance Summary section, Average Step Time is replaced by:
- Average Session Time (inference only): A chart showing the distribution of session times over all sessions, including the average session time.
GPU specific
In the Step-time Breakdown, the average step time is divided into multiple categories:
- All Other Time: All other time, including Python overhead.
- Compilation Time: Time spent on compiling kernels.
- Output Time: Time spent on writing output data.
- Input Time: Time spent on reading input data.
- Kernel Launch Time: Host time for launching kernels.
- Host Compute Time: Host computation time.
- Device Collective Communication Time: Time spent in collective GPU communications.
- Device to Device Time: Device-to-device communication time.
- Device Compute Time: On-device computation time.
The Performance Summary for GPU profiles includes the following fields:
- TF Op Placement: Whether the op is running on the host or device.
- Op Time Spent on Eager Executions: This metric helps guide potential optimizations related to overuse of eager execution (in contrast to the graph execution).
- Device Compute Precisions: Reports the percentage of device compute time that uses 16-bit computation and 32-bit computation.