
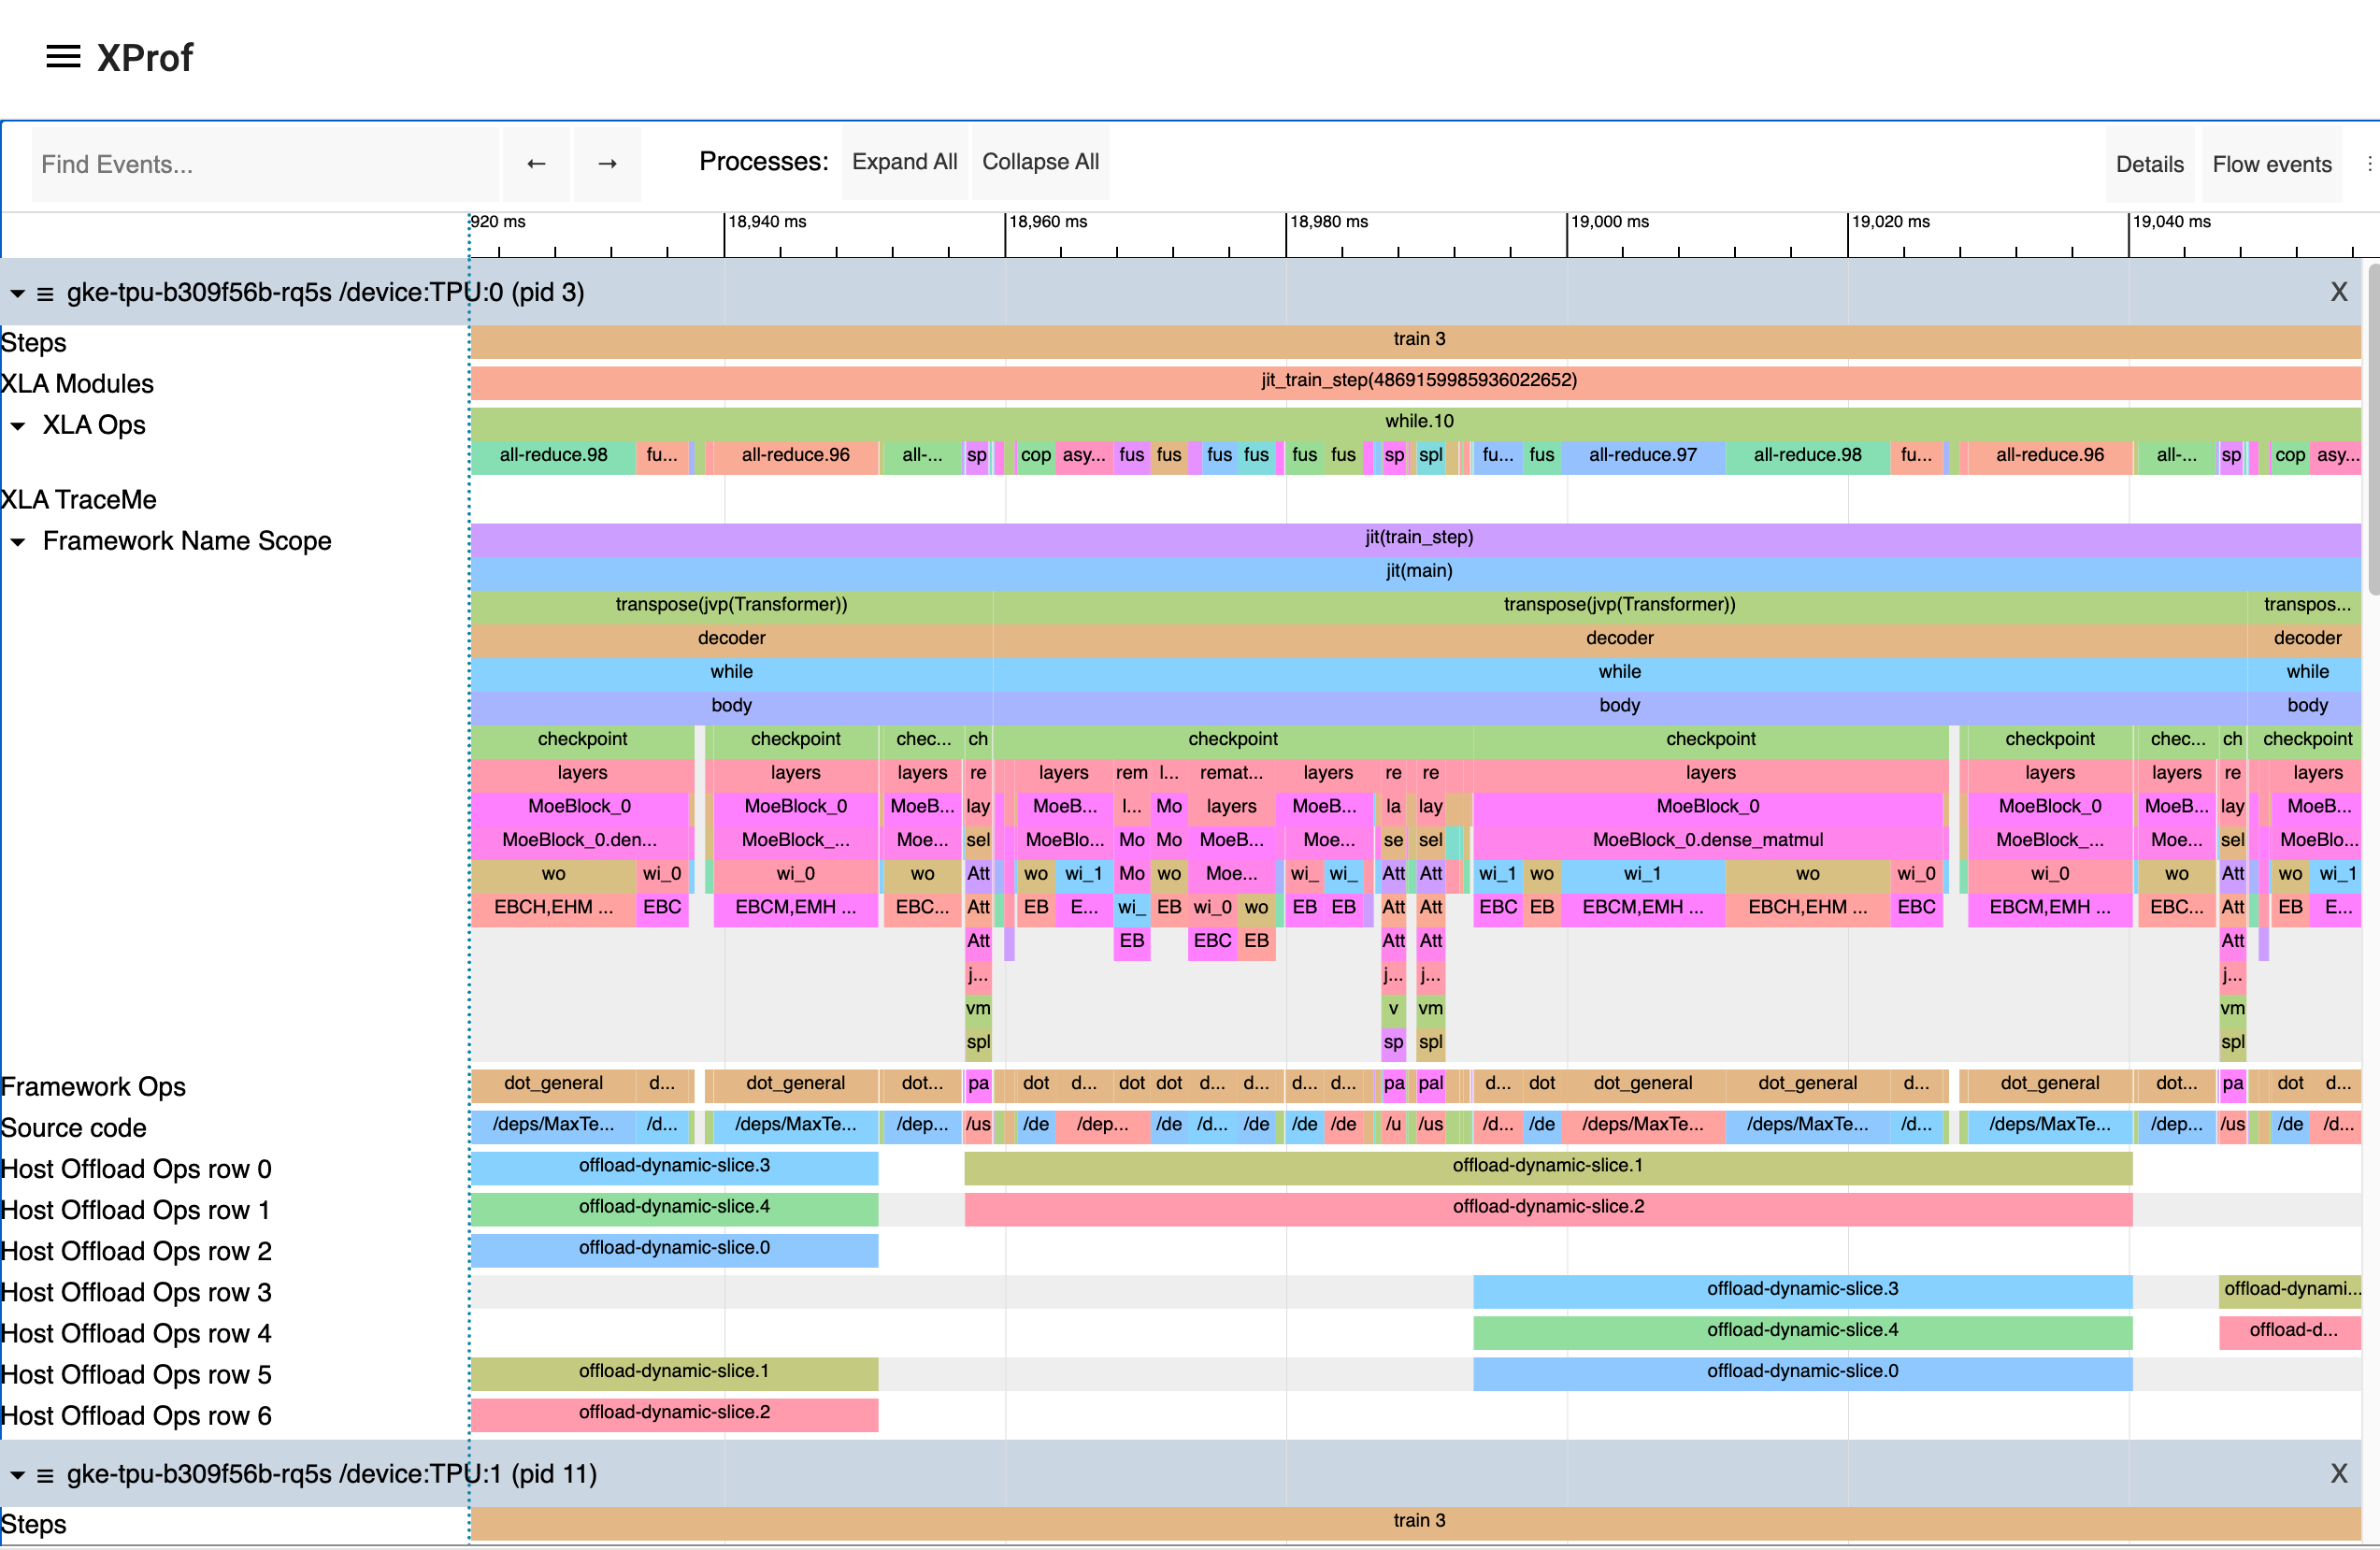
XProf is a great way to acquire and visualize performance traces and profiles of your program, including activity on GPU and TPU. The end result looks something like this:
Programmatic capture
You can instrument your code to capture a profiler trace for JAX code via the
jax.profiler.start_trace
and jax.profiler.stop_trace
methods. Call
jax.profiler.start_trace
with the directory to write trace files to. This should be the same --logdir
directory used to start XProf. Then, you can XProf to view the traces.
For example, to take a profiler trace:
import jax

jax.profiler.start_trace("/tmp/profile-data")

# Run the operations to be profiled
key = jax.random.key(0)
x = jax.random.normal(key, (5000, 5000))
y = x @ x
y.block_until_ready()

jax.profiler.stop_trace()
Note the jax.block_until_ready
call. We use this to make sure on-device execution is captured by the trace. See
Asynchronous dispatch for
details on why this is necessary.
You can also use the
jax.profiler.trace
context manager as an alternative to start_trace and stop_trace:
import jax

with jax.profiler.trace("/tmp/profile-data"):
  key = jax.random.key(0)
  x = jax.random.normal(key, (5000, 5000))
  y = x @ x
  y.block_until_ready()
Viewing the trace
After capturing a trace, you can view it using the XProf UI.
You can launch the profiler UI directly using the standalone XProf command by pointing it to your log directory:
$ xprof --port=8791 /tmp/profile-data
Attempting to start XProf server:
  Log Directory: /tmp/profile-data
  Port: 8791
  Worker Service Address: 0.0.0.0:50051
  Hide Capture Button: False
XProf at http://localhost:8791/ (Press CTRL+C to quit)
Navigate to the provided URL (e.g., http://localhost:8791/) in your browser
to view the profile.
Available traces appear in the "Sessions" dropdown menu on the left. Select the session you're interested in, and then under the "Tools" dropdown, select "Trace Viewer". You should now see a timeline of the execution. You can use the WASD keys to navigate the trace, and click or drag to select events for more details. See the Trace Viewer Tool documentation for more details on using the trace viewer.
Manual capture via XProf
The following are instructions for capturing a manually-triggered N-second trace from a running program.
Start an XProf server:
xprof --logdir /tmp/profile-data/You should be able to load XProf at
<http://localhost:8791/>. You can specify a different port with the--portflag.In the Python program or process you'd like to profile, add the following somewhere near the beginning:
import jax.profiler
jax.profiler.start_server(9999)
This starts the profiler server that XProf connects to. The profiler server must be running before you move on to the next step. When you're done using the server, you can call
jax.profiler.stop_server()to shut it down.If you'd like to profile a snippet of a long-running program (e.g. a long training loop), you can put this at the beginning of the program and start your program as usual. If you'd like to profile a short program (e.g. a microbenchmark), one option is to start the profiler server in an IPython shell, and run the short program with
%runafter starting the capture in the next step. Another option is to start the profiler server at the beginning of the program and usetime.sleep()to give you enough time to start the capture.Open
<http://localhost:8791/>, and click the "CAPTURE PROFILE" button in the upper left. Enter "localhost:9999" as the profile service URL (this is the address of the profiler server you started in the previous step). Enter the number of milliseconds you'd like to profile for, and click "CAPTURE".If the code you'd like to profile isn't already running (e.g. if you started the profiler server in a Python shell), run it while the capture is running.
After the capture finishes, XProf should automatically refresh. (Not all of the XProf profiling features are hooked up with JAX, so it may initially look like nothing was captured.) On the left under "Tools", select "Trace Viewer".
You should now see a timeline of the execution. You can use the WASD keys to navigate the trace, and click or drag to select events to see more details at the bottom. See the Trace Viewer Tool documentation for more details on using the trace viewer.
Capture continuous profiling snapshots
The following are the instructions to capture a continuous profiling snapshot at any time instant.
- In the Python program or process you'd like to profile, add the following somewhere near the beginning:
import jax.profiler
jax.profiler.start_server(9999)
- Start Continuous Profiling independently of your program:
from xprof.api import continuous_profiling_snapshot
continuous_profiling_snapshot.start_continuous_profiling('localhost:9999', {})
- Get a snapshot:
from xprof.api import continuous_profiling_snapshot
continuous_profiling_snapshot.get_snapshot('localhost:9999', '/tmp/profile-data/')
- Stop Continuous Profiling:
from xprof.api import continuous_profiling_snapshot
continuous_profiling_snapshot.stop_continuous_profiling('localhost:9999')
- Start XProf:
xprof --port=8791 /tmp/profile-data
You should now see a timeline of the execution. You can use the WASD keys to navigate the trace, and click or drag to select events to see more details at the bottom. See the Trace Viewer Tool documentation for more details on using the trace viewer.
XProf and Tensorboard
XProf is the underlying tool that powers the profiling and trace capturing
functionality in Tensorboard. As long as xprof is installed, a "Profile" tab
will be present within Tensorboard. Using this is identical to launching XProf
independently, as long as it is launched pointing to the same log directory.
This includes profile capture, analysis, and viewing functionality. XProf
supplants the tensorboard_plugin_profile functionality that was previously
recommended.
$ tensorboard --logdir=/tmp/profile-data
[...]
Serving TensorBoard on localhost; to expose to the network, use a proxy or pass --bind_all
TensorBoard 2.19.0 at http://localhost:6006/ (Press CTRL+C to quit)
Adding custom trace events
By default, the events in the trace viewer are mostly low-level internal JAX
functions. You can add your own events and functions by using
jax.profiler.TraceAnnotation
and jax.profiler.annotate_function
in your code.
Configuring profiler options
The start_trace method accepts an optional profiler_options parameter, which
allows for fine-grained control over the profiler's behavior. This parameter
should be an instance of jax.profiler.ProfileOptions.
For example, to disable all python and host traces:
import jax

options = jax.profiler.ProfileOptions()
options.python_tracer_level = 0
options.host_tracer_level = 0
jax.profiler.start_trace("/tmp/profile-data", profiler_options=options)

# Run the operations to be profiled
key = jax.random.key(0)
x = jax.random.normal(key, (5000, 5000))
y = x @ x
y.block_until_ready()

jax.profiler.stop_trace()
General options
host_tracer_level: Sets the trace level for host-side activities.Supported Values:
0: Disables host (CPU) tracing entirely.1: Enables tracing of only user-instrumented TraceMe events.2: Includes level 1 traces plus high-level program execution details like expensive XLA operations (default).3: Includes level 2 traces plus more verbose, low-level program execution details such as cheap XLA operations.
device_tracer_level: Controls whether device tracing is enabled.Supported Values:
0: Disables device tracing.1: Enables device tracing (default).
python_tracer_level: Controls whether Python tracing is enabled.Supported Values:
0: Disables Python function call tracing (default).1: Enables Python tracing.
Advanced configuration options
[!NOTE] For a complete list of advanced profiling flags, including power monitoring and periodic counter sampling, see Advanced Profiler Options.
TPU options
tpu_trace_mode: Specifies the mode for TPU tracing.Supported Values:
TRACE_ONLY_HOST: This means only host-side (CPU) activities are traced, and no device (TPU/GPU) traces are collected.TRACE_ONLY_XLA: This means only XLA-level operations on the device are traced.TRACE_COMPUTE: This traces compute operations on the device.TRACE_COMPUTE_AND_SYNC: This traces both compute operations and synchronization events on the device.
If "tpu_trace_mode" is not provided the trace_mode defaults to
TRACE_ONLY_XLA.tpu_num_sparse_cores_to_trace: Specifies the number of sparse cores to trace on the TPU.tpu_num_sparse_core_tiles_to_trace: Specifies the number of tiles within each sparse core to trace on the TPU.tpu_num_chips_to_profile_per_task: Specifies the number of TPU chips to profile per task.tpu_cpu_perf_counter_profile_events: Specifies a comma-separated list of CPU performance counter events to profile by name (e.g.,"context-switches,page-faults"). This is the recommended way to profile CPU events because string names are automatically resolved to hardware/software types.tpu_cpu_perf_counter_configs: Specifies a comma-separated list of CPU performance counter configurations. Each configuration is structured asconfig:type:namewhereconfigandtypemap directly to the integer fields in the Linuxperf_event_attrstruct, andnameis a custom string label. This is an advanced fallback option for passing RAW events or custom PMU configs not recognized by name. For example:"3:1:context-switches".
GPU options
The following options are available for GPU profiling:
gpu_max_callback_api_events: Sets the maximum number of events collected by the CUPTI callback API. Defaults to2*1024*1024.gpu_max_activity_api_events: Sets the maximum number of events collected by the CUPTI activity API. Defaults to2*1024*1024.gpu_max_annotation_strings: Sets the maximum number of annotation strings that can be collected. Defaults to1024*1024.gpu_enable_nvtx_tracking: Enables NVTX tracking in CUPTI. Defaults toFalse.gpu_enable_cupti_activity_graph_trace: Enables CUPTI activity graph tracing for CUDA graphs. Defaults toFalse.gpu_pm_sample_counters: A comma-separated string of GPU Performance Monitoring metrics to collect using CUPTI's PM sampling feature (e.g."sm__cycles_active.avg.pct_of_peak_sustained_elapsed"). PM sampling is disabled by default. For available metrics, see NVIDIA's CUPTI documentation.gpu_pm_sample_interval_us: Sets the sampling interval in microseconds for CUPTI PM sampling. Defaults to500.gpu_pm_sample_buffer_size_per_gpu_mb: Sets the system memory buffer size per device in MB for CUPTI PM sampling. Defaults to 64MB. The maximum supported value is 4GB.gpu_num_chips_to_profile_per_task: Specifies the number of GPU devices to profile per task. If not specified, set to 0, or set to an invalid value, all available GPUs will be profiled. This can be used to decrease the trace collection size.gpu_dump_graph_node_mapping: If enabled, dumps CUDA graph node mapping information into the trace. Defaults toFalse.
For example:
options = ProfileOptions()
options.advanced_configuration = {"tpu_trace_mode" : "TRACE_ONLY_HOST", "tpu_num_sparse_cores_to_trace" : 2}
Returns InvalidArgumentError if any unrecognized keys or option values are
found.