
This guide demonstrates how to use the tools available with XProf to track the performance of your TensorFlow models on the host (CPU), the device (GPU), or on a combination of both the host and device(s).
Profiling helps understand the hardware resource consumption (time and memory) of the various TensorFlow operations (ops) in your model and resolve performance bottlenecks and, ultimately, make the model execute faster.
This guide will walk you through how to use the various tools available and the different modes of how the Profiler collects performance data.
If you want to profile your model performance on Cloud TPUs, refer to the Cloud TPU guide.
Collect performance data
XProf collects host activities and GPU traces of your TensorFlow model. You can configure XProf to collect performance data through either the programmatic mode or the sampling mode.
Profiling APIs
You can use the following APIs to perform profiling.
Programmatic mode using the TensorBoard Keras Callback (
tf.keras.callbacks.TensorBoard)# Profile from batches 10 to 15 tb_callback = tf.keras.callbacks.TensorBoard(log_dir=log_dir, profile_batch='10, 15') # Train the model and use the TensorBoard Keras callback to collect # performance profiling data model.fit(train_data, steps_per_epoch=20, epochs=5, callbacks=[tb_callback])Programmatic mode using the
tf.profilerFunction APItf.profiler.experimental.start('logdir') # Train the model here tf.profiler.experimental.stop()Programmatic mode using the context manager
with tf.profiler.experimental.Profile('logdir'):
    # Train the model here
    pass
Sampling mode: Perform on-demand profiling by using
tf.profiler.experimental.server.startto start a gRPC server with your TensorFlow model run. After starting the gRPC server and running your model, you can capture a profile through the Capture Profile button in XProf. Use the script in the Install profiler section above to launch a TensorBoard instance if it is not already running.As an example,
# Start a profiler server before your model runs.
tf.profiler.experimental.server.start(6009)
# (Model code goes here).
#  Send a request to the profiler server to collect a trace of your model.
tf.profiler.experimental.client.trace('grpc://localhost:6009',
                                      'gs://your_tb_logdir', 2000)
An example for profiling multiple workers:
# E.g., your worker IP addresses are 10.0.0.2, 10.0.0.3, 10.0.0.4, and you
# would like to profile for a duration of 2 seconds.
tf.profiler.experimental.client.trace(
    'grpc://10.0.0.2:8466,grpc://10.0.0.3:8466,grpc://10.0.0.4:8466',
    'gs://your_tb_logdir',
    2000)
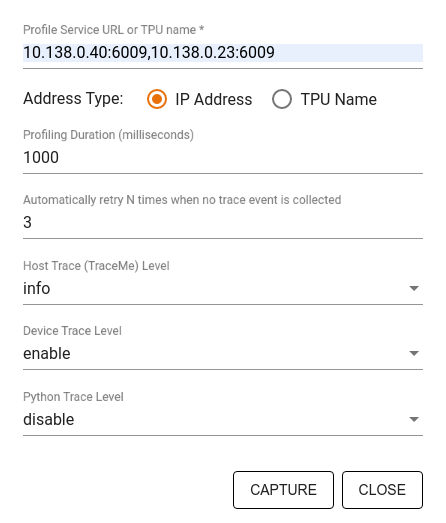
Use the Capture Profile dialog to specify:
- A comma-delimited list of profile service URLs or TPU names.
- A profiling duration.
- The level of device, host, and Python function call tracing.
- How many times you want the Profiler to retry capturing profiles if unsuccessful at first.
Profiling custom training loops
To profile custom training loops in your TensorFlow code, instrument the
training loop with the tf.profiler.experimental.Trace API to mark the step
boundaries for XProf.
The name argument is used as a prefix for the step names, the step_num
keyword argument is appended in the step names, and the _r keyword argument
makes this trace event get processed as a step event by XProf.
As an example,
for step in range(NUM_STEPS):
    with tf.profiler.experimental.Trace('train', step_num=step, _r=1):
        train_data = next(dataset)
        train_step(train_data)
This will enable XProf's step-based performance analysis and cause the step events to show up in the trace viewer.
Make sure that you include the dataset iterator within the
tf.profiler.experimental.Trace context for accurate analysis of the input
pipeline.
The code snippet below is an anti-pattern:
for step, train_data in enumerate(dataset):
    with tf.profiler.experimental.Trace('train', step_num=step, _r=1):
        train_step(train_data)
Profiling use cases
The profiler covers a number of use cases along four different axes. Some of the combinations are currently supported and others will be added in the future. Some of the use cases are:
- Local vs. remote profiling: These are two common ways of setting up your profiling environment. In local profiling, the profiling API is called on the same machine your model is executing, for example, a local workstation with GPUs. In remote profiling, the profiling API is called on a different machine from where your model is executing, for example, on a Cloud TPU.
- Profiling multiple workers: You can profile multiple machines when using the distributed training capabilities of TensorFlow.
- Hardware platform: Profile CPUs, GPUs, and TPUs.
The table below provides a quick overview of the TensorFlow-supported use cases mentioned above:
| Profiling API | Local | Remote | Multiple workers | Hardware Platforms |
|---|---|---|---|---|
| TensorBoard Keras Callback | Supported | Not Supported | Not Supported | CPU, GPU |
tf.profiler.experimental
start/stop API |
Supported | Not Supported | Not Supported | CPU, GPU |
tf.profiler.experimental
client.trace API |
Supported | Supported | Supported | CPU, GPU, TPU |
| Context manager API | Supported | Not supported | Not Supported | CPU, GPU |
Additional resources
- The TensorFlow Profiler: Profile model performance tutorial with Keras and TensorBoard where you can apply the advice in this guide.
- The Performance profiling in TensorFlow 2 talk from the TensorFlow Dev Summit 2020.
- The TensorFlow Profiler demo from the TensorFlow Dev Summit 2020.