
This tool is currently only available in nightly builds.
Goal
The goal of this tool is to provide a bird's eye view of the performance of a TPU system and allow a performance analyst to spot parts of the system that may be having performance issues.
Visualizing Chip-level Utilization
To use the tool, from the "Drawer" on the left, look for the tool "Utilization Viewer". The tool displays 4 bar charts showing the utilization of execution units (top 2 charts) and DMA paths (bottom 2 charts) for the 2 Tensor Nodes in a TPU chip.
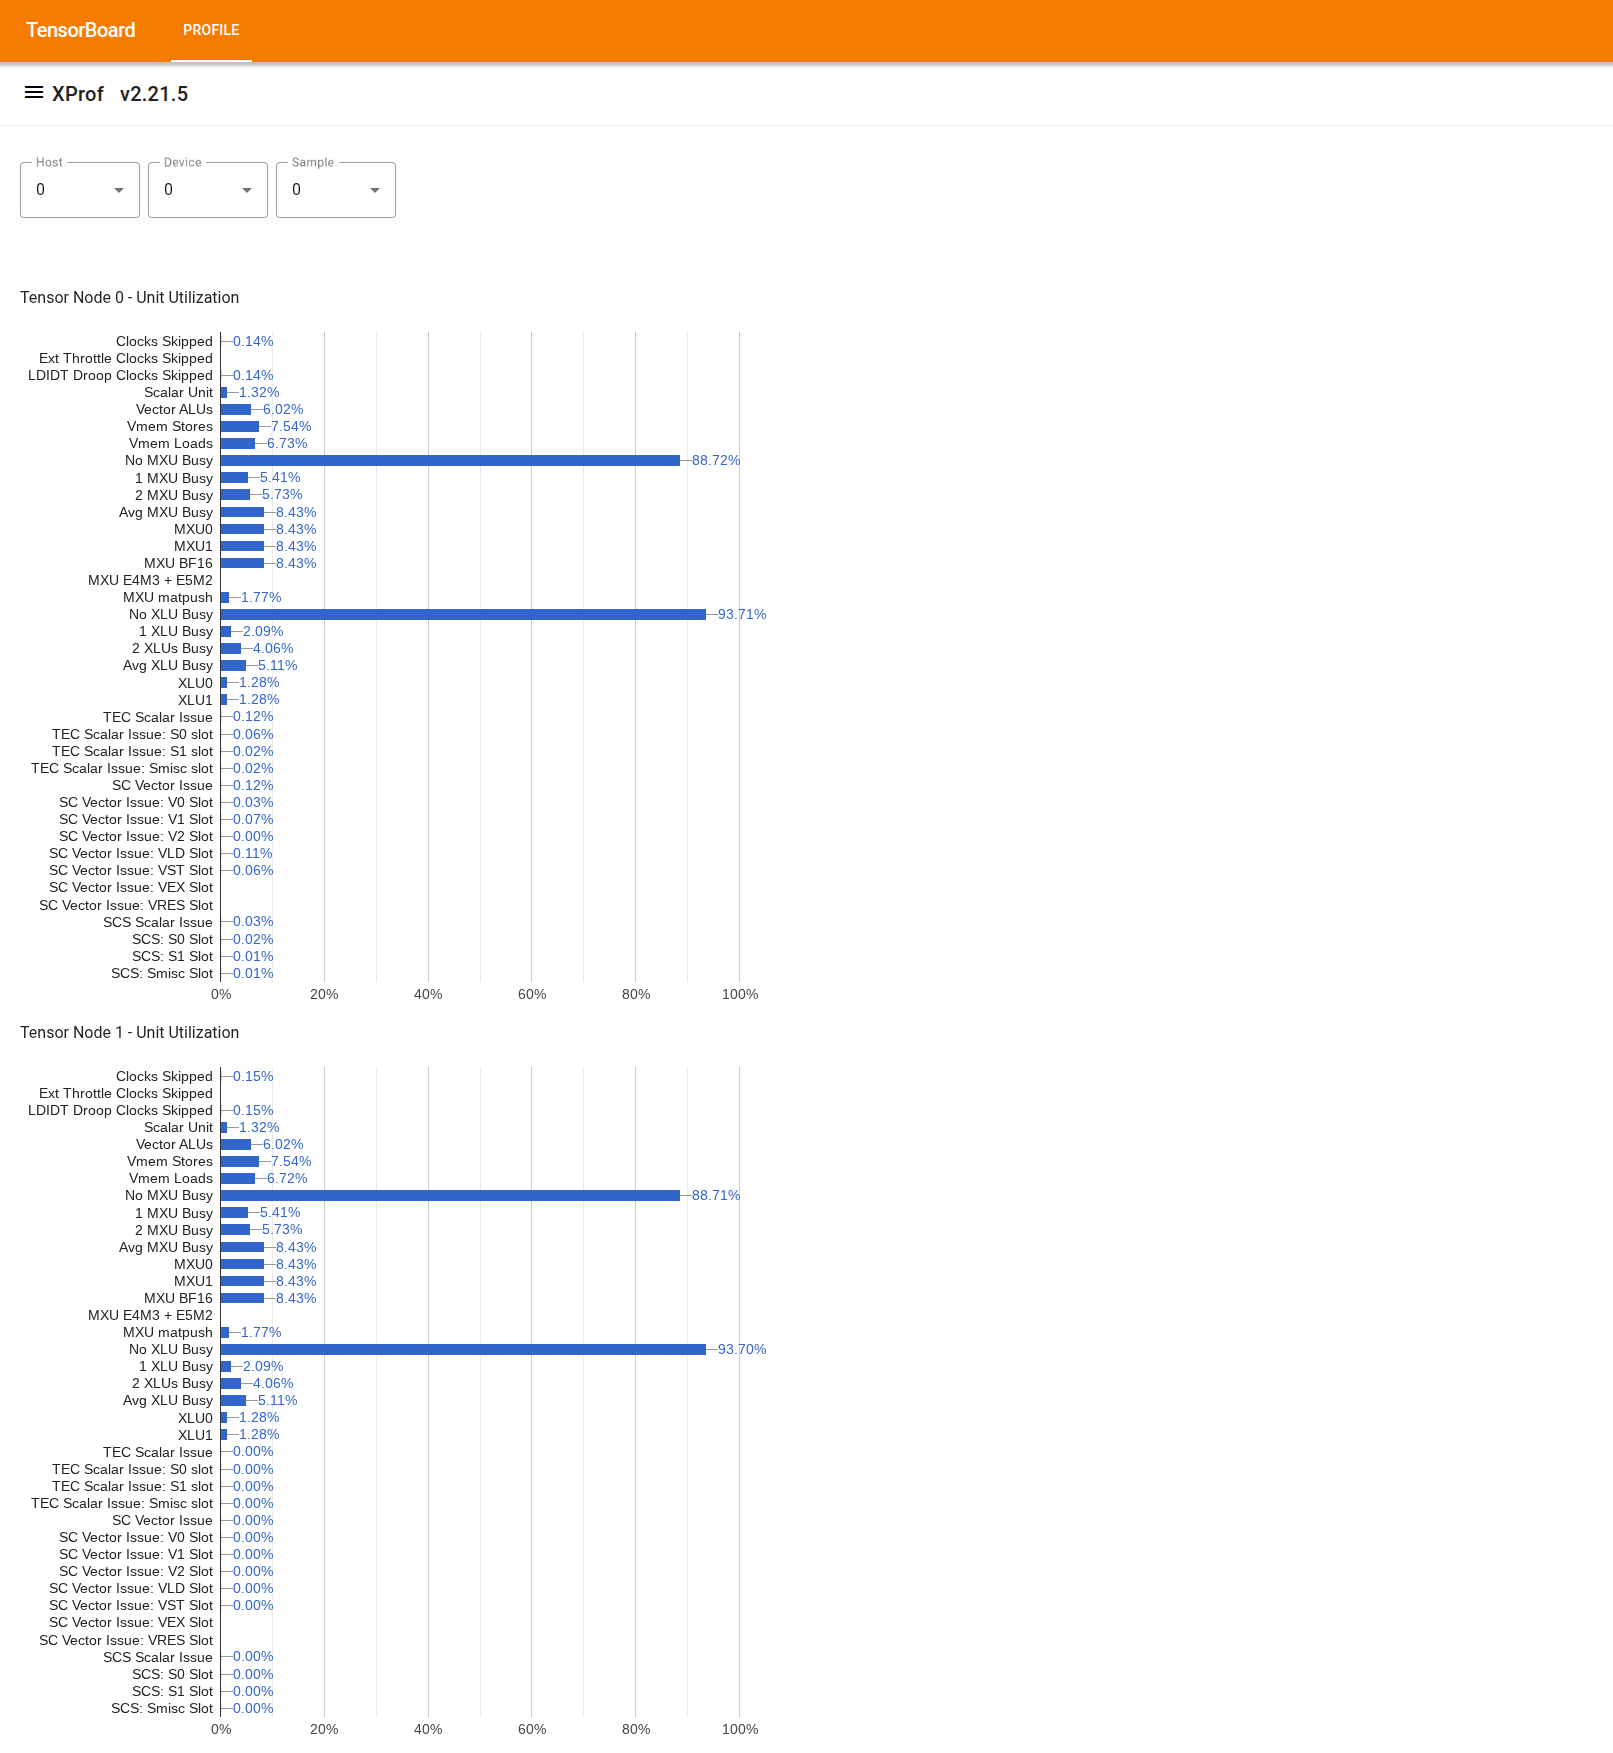
Hovering over a bar shows a tooltip with details about the utilization: "achieved" and (theoretical) "peak" amounts. The utilization percentage shown in the bar is obtained by dividing the "achieved" amount over by the "peak" amount. The achieved and peak amounts are expressed in units of instructions for the execution unit utilization, and bytes for bandwidth utilization.
The utilization of an execution unit is the fraction of cycles that the unit was busy within the profiling period.
The utilization of the following tensor core execution units is shown:
- Scalar Unit: Computed as the sum of
count_s0_instructionandcount_s1_instruction, i.e., the number of scalar instructions, divided by double the number of cycles, because the scalar unit throughput is 2 instructions per cycle. - Vector ALUs: Computed as the sum of
count_v0_instructionandcount_v1_instruction, i.e., the number of vector instructions, divided by double the number of cycles, because the vector ALUs throughput is 2 instructions per cycle. - Vector Stores: Computed as
count_vector_store, i.e., the number of vector stores, divided by the number of cycles, because the vector store throughput is 1 instruction per cycle. - Vector Loads: Computed as
count_vector_load, i.e., the number of vector loads, divided by the number of cycles, because the vector load throughput is 1 instruction per cycle. - Matrix Unit (MXU): Computed as
count_matmuldivided by 1/8th the number of cycles, because the MXU throughput is 1 instruction per 8 cycles. - Transpose Unit (XU): Computed as
count_transposedivided 1/8th the number of cycles, because XU throughput is 1 instruction per 8 cycles. - Reduction and Permutation Unit (RPU): Computed as
count_rpu_instructiondivided by 1/8th the number of cycles, because the RPU throughput is 1 instruction per 8 cycles.
The following figure is a block diagram of the tensor core showing the execution units:
flowchart LR
classDef redBox fill:#c96665,stroke:#000,stroke-width:2px,color:#000,font-weight:bold;
classDef whiteBox fill:#fff,stroke:#000,stroke-width:2px,color:#000,font-weight:bold;
classDef invisible fill:none,stroke:none;

classDef container fill:#f9f9f9,stroke:#666,stroke-width:3px,stroke-dasharray: 10 5,color:#666,font-size:20px;

subgraph TensorCore [TensorCore]
    direction LR

    subgraph LeftCol [ ]
        direction TB
        CS["Core<br>Sequencer<br>(CS)"]:::redBox
        VPU["Vector<br>Programmable<br>Unit<br>(VPU)"]:::whiteBox

        CS --> VPU
    end

    subgraph RightCol [ ]
        direction TB
        MXU["Matrix Unit<br>(MXU)"]:::whiteBox
        XU["Transpose Unit<br>(XU)"]:::whiteBox
        RPU["Reduction and<br>Permutation<br>Unit<br>(RPU)"]:::whiteBox
    end

    VPU <==> MXU
    VPU <==> XU
    VPU <==> RPU
end

class TensorCore container
class LeftCol,RightCol invisible
For more details on each of these execution units, please refer to TPU architecture.
- Scalar Unit: Computed as the sum of
The utilization of DMA paths is the fraction of bandwidth (bytes/cycle) that was used during the profiling period. It is derived from NF_CTRL counters.
The following figure shows 7 nodes representing sources / destinations of DMAs, and the 14 DMA paths in a Tensor Node. The "BMem to VMem" and "Bmem to ICI" paths in the figure are actually a shared path accumulated by a single counter, shown as "BMem to ICI/VMem" in the tool. A DMA sent to ICI is a DMA to a remote HBM or VMEM, while a DMA from/to HIB is a DMA from/to host memory.
flowchart TD
  HIB[HIB]
  HBM[HBM]
  IMem[IMem]
  SMem[SMem]
  BMem[BMem]
  VMem[VMem]
  ICI[ICI]

  HIB --> HBM
  HBM --> HIB

  subgraph Memory_Units [ ]
      direction LR
      style Memory_Units fill:none,stroke:none
      IMem
      SMem
      BMem
      VMem
  end

  HBM --> IMem
  HBM --> SMem
  HBM --> BMem
  HBM --> VMem

  BMem --> VMem
  BMem --> ICI
  VMem --> ICI
  ICI --> VMem

  ICI --> HBM
  VMem --> HBM
  BMem --> HBM
  SMem --> HBM

  HBM --> ICI