
XLA Custom Calls allow you to execute custom kernels or operations that are not natively supported by XLA. To gain visibility into the performance of these custom calls within the Trace Viewer, you can use specific XLA flags to enable detailed tracing and LLO (Low-Level Optimizer) debug information.
Enabling Custom Call Visibility
To enable custom call profiling, you need to set the following XLA flags when running your workload:
--xla_enable_custom_call_region_trace=true: This flag enables tracing for regions containing custom calls.--xla_xprof_register_llo_debug_info=true: This flag registers LLO debug information, which allows XProf to display detailed utilization statistics for the custom call.
Example :
LIBTPU_INIT_ARGS="--xla_enable_custom_call_region_trace=true --xla_xprof_register_llo_debug_info=true" python your_jax_workload.py
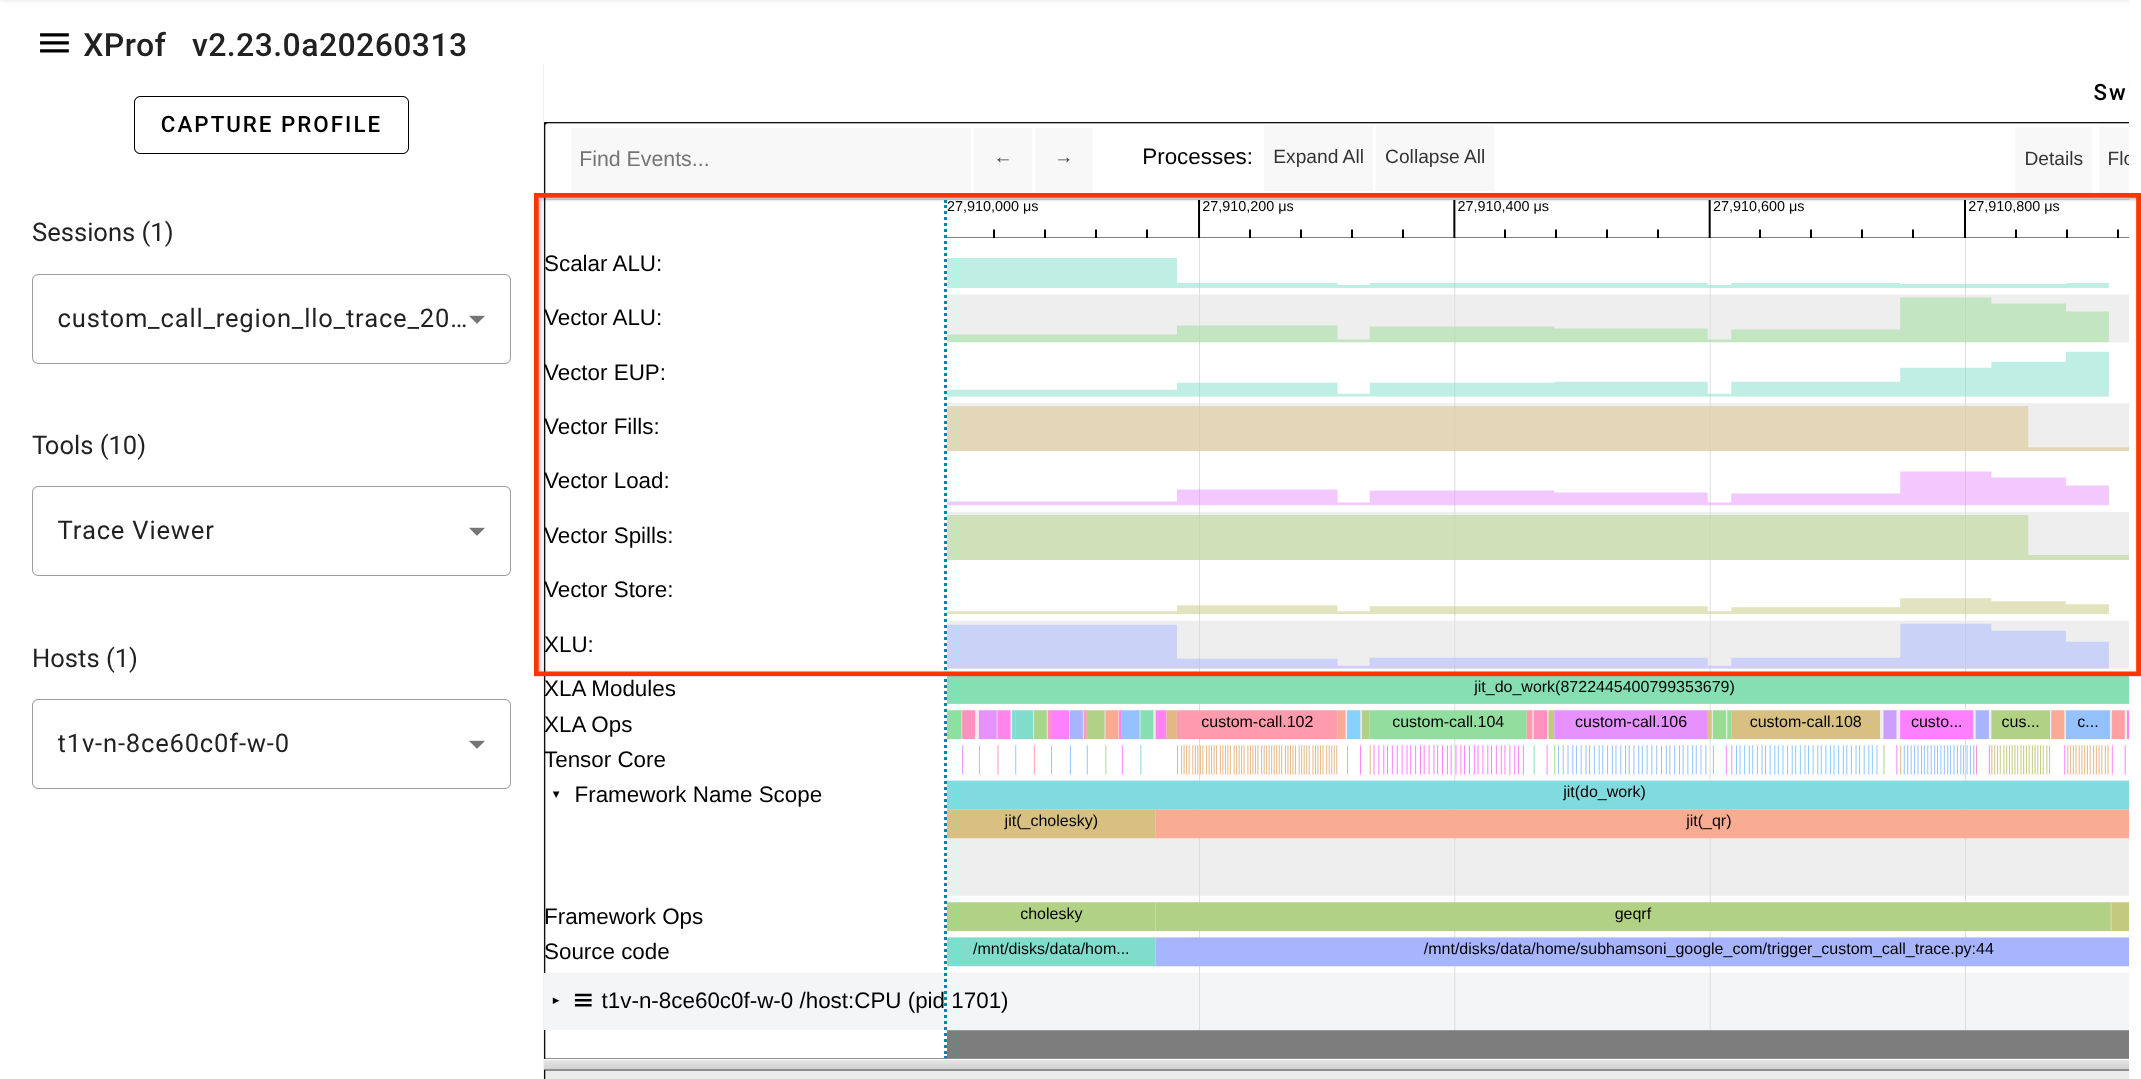
When these flags are enabled, a new LLO utilization line will appear in the Trace Viewer for each TPU core or device executing the custom call.
LLO Utilization Line
The LLO utilization line provides a visualization of how hardware resources are used during the execution of a custom call. This is particularly useful for identifying bottlenecks within custom kernels (e.g., those written in Pallas or Mosaic).
Best Practices
- Only enable when needed: These flags can increase the size of the captured profile and may slightly impact performance during collection. Use them primarily for debugging and optimizing custom calls.
- Check for LLO information: If you enable these flags but don't see the LLO utilization line, ensure that your compiler backend supports registering LLO debug info for your specific custom call implementation.