
XLA Custom Calls allow you to execute custom kernels or operations that are not natively supported by XLA. To gain visibility into the performance of these custom calls within the Trace Viewer, you can use specific XLA flags to enable detailed tracing and LLO (Low-Level Optimizer) debug information.
⚠️ EXPERIMENTAL FEATURE: Low Level Optimizer (LLO) analysis and custom call profiling are experimental. To access these features and all CLI analysis tools (
get_kernel_stats,get_llo_analysis,get_llo_debug_string), installxprof-nightly. The standardxprofPyPI release (2.23.1) lacks these subcommands.
Prerequisites & Toolchain Requirements
Before capturing LLO traces, verify that your environment meets the following requirements:
- Python 3.11+ (Python 3.12 recommended): Default Cloud TPU VM images
(Ubuntu 22.04) ship with system Python 3.10.12, which silently caps JAX at
version 0.6.2 and pulls
libtpu0.0.17. Olderlibtpubuilds lack LLO flag definitions, causingERROR: Unknown command line flagor returning empty LLO profiles. Usinguvto manage a Python 3.12 virtual environment is strongly recommended. Package Installation (
xprof-nightly): Installxprof-nightlyalongsidejax[tpu]:# 1. Setup Python 3.12 environment pip install uv uv python install 3.12 uv venv --python 3.12 ~/venvs/v312 # 2. Install xprof-nightly and JAX uv pip install --python ~/venvs/v312/bin/python \ 'jax[tpu]>=0.11.0' xprof-nightly numpy ml_dtypes absl-py fireJAX >= 0.11.0: Recommended toolchain version (
libtpu >= 0.0.44). Note that compile-time LLO debug info (--xla_xprof_register_llo_debug_info=true) is supported starting injax >= 0.10.2(libtpu >= 0.0.42), while opt-in runtime custom call tracing (--xla_xprof_enable_custom_call_tracing=true) requiresjax >= 0.11.0(libtpu >= 0.0.44).Strict Environment Ordering:
LIBTPU_INIT_ARGSmust be exported in the shell or configured inos.environstrictly beforeimport jax.libtpuparses initialization flags upon the very first import of JAX; setting them afterimport jaxsilently has no effect without raising an exception.
Hardware Compatibility Matrix
| Capability | Hardware Requirement | Notes |
|---|---|---|
LLO Analysis & Disassembly (get_llo_analysis, get_llo_debug_string) |
Any supported TPU (v6e, v5e, v4, etc.) | Fully supported on TPU v6e and v5e (libtpu >= 0.0.42); not gated to v7x. |
Custom Call Tracing (--xla_xprof_enable_custom_call_tracing=true) |
Any supported TPU (libtpu >= 0.0.44 / jax >= 0.11.0) |
Captures fine-grained runtime LLO trace details (increases trace size; tune vtrace frequency via How to Tune if events drop). Absent in libtpu 0.0.42 (jax 0.10.2), where setting it aborts the backend. |
Periodic Runtime Counters (tpu_enable_periodic_counter_sampling) |
Ironwood TPU7x+ only | Hardware performance counters require TPU v7x+. |
Flag Availability Diagnostic
To verify that your installed libtpu binary contains the required flag
definitions before launching workloads, run this diagnostic snippet:
import glob
import os
import libtpu

so_paths = glob.glob(os.path.dirname(libtpu.__file__) + "/*libtpu*.so")
if so_paths:
  blob = open(so_paths[0], "rb").read()
  for flag in (
      b"xla_xprof_register_llo_debug_info",
      b"xla_xprof_enable_custom_call_tracing",
      b"tpu_enable_periodic_counter_sampling",
  ):
    print(flag.decode(), "PRESENT" if flag in blob else "ABSENT")
How to Enable Tracing
Recommended default: LLO debug info only
For static LLO analysis and HLO/kernel-level profiling, register LLO debug info
with --xla_xprof_register_llo_debug_info=true. This keeps the full HLO op
stream intact so get_hlo_stats, get_roofline_model, get_top_hlo_ops, and
get_kernel_stats all work without extra runtime trace overhead, while
producing the complete compile-time LLO source map used by get_llo_analysis
and get_llo_debug_string.
import os

# Flags MUST precede any jax / libtpu import
os.environ["LIBTPU_INIT_ARGS"] = "--xla_xprof_register_llo_debug_info=true"

import jax
# Workload definition and tracing...
--xla_xprof_register_llo_debug_info=true: Registers LLO debug information, opcodes, and metadata for XProf visualization.
Fine-grained runtime LLO bundle tracing
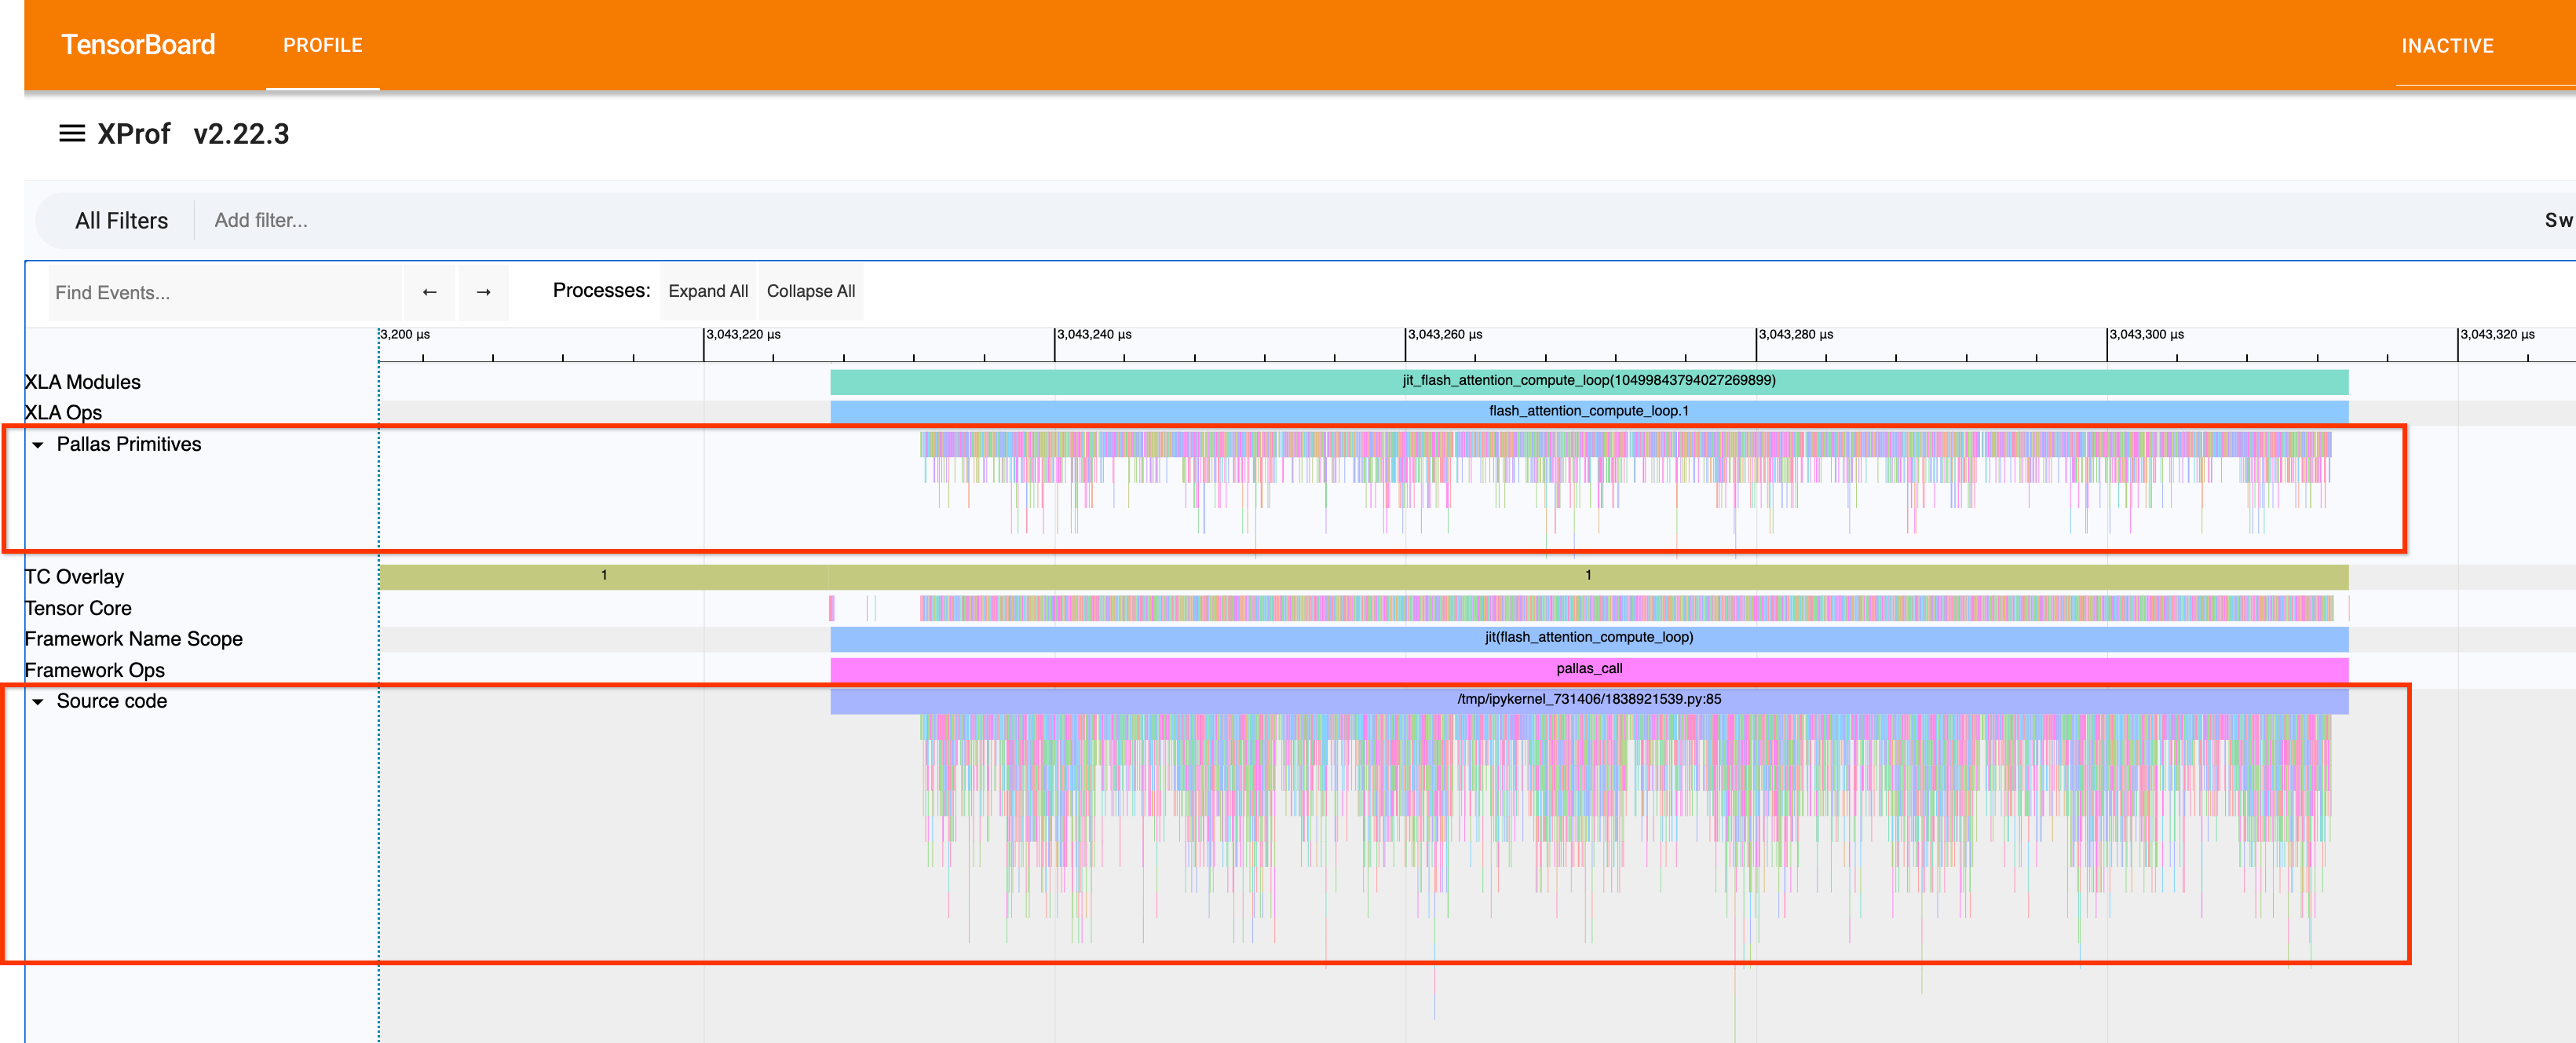
--xla_xprof_enable_custom_call_tracing=true: Canonical flag that enables fine-grained runtime LLO execution details (Pallas Primitives,LLO Ops, and per-unit instruction lanes in Trace Viewer) and automatically activates instruction bundle instrumentation (xla_tpu_bundle_instrumentation_optionswith defaulttrace_best_effort_frequency=10andtrace_guaranteed_frequency=10).
| Pallas FlashAttention (10 iters, 8×4096×128 bf16) | --xla_xprof_register_llo_debug_info=true only |
Both flags (+ --xla_xprof_enable_custom_call_tracing=true, default freq=10) |
|---|---|---|
| TPU v6e-1 trace size | 19.8 MB | 127 MB (6.4×) |
TPU v6e-1 get_llo_analysis (static) |
10 modules, 103,224 instr (0.6 s) | Identical (2.7 s) |
TPU v6e-1 get_hlo_stats / get_top_hlo_ops |
flash_attention.1, 10×, 28.4 ms |
NO_DATA / only IDLE |
TPU v6e-1 get_kernel_stats |
flash_attention.1, 28,363 µs |
Custom call dropped; only barrier-cores (25,672 µs) |
| TPU v7x (2×2×1) trace size | 115 MB | 1.42 GB (12.3×) |
TPU v7x get_llo_analysis (static) |
10 modules, 103,239 instr (1.9 s) | Identical (33.6 s) |
TPU v7x get_kernel_stats |
flash_attention.1, 29,725 µs (1.3 s) |
flash_attention.1, 27,098 µs (−8.8%, 19.0 s) |
When using --xla_xprof_enable_custom_call_tracing=true, tune the vtrace
frequency (trace_best_effort_frequency and trace_guaranteed_frequency in
xla_tpu_bundle_instrumentation_options; see How to Tune below)
if the increased trace size overflows the hardware trace buffer.
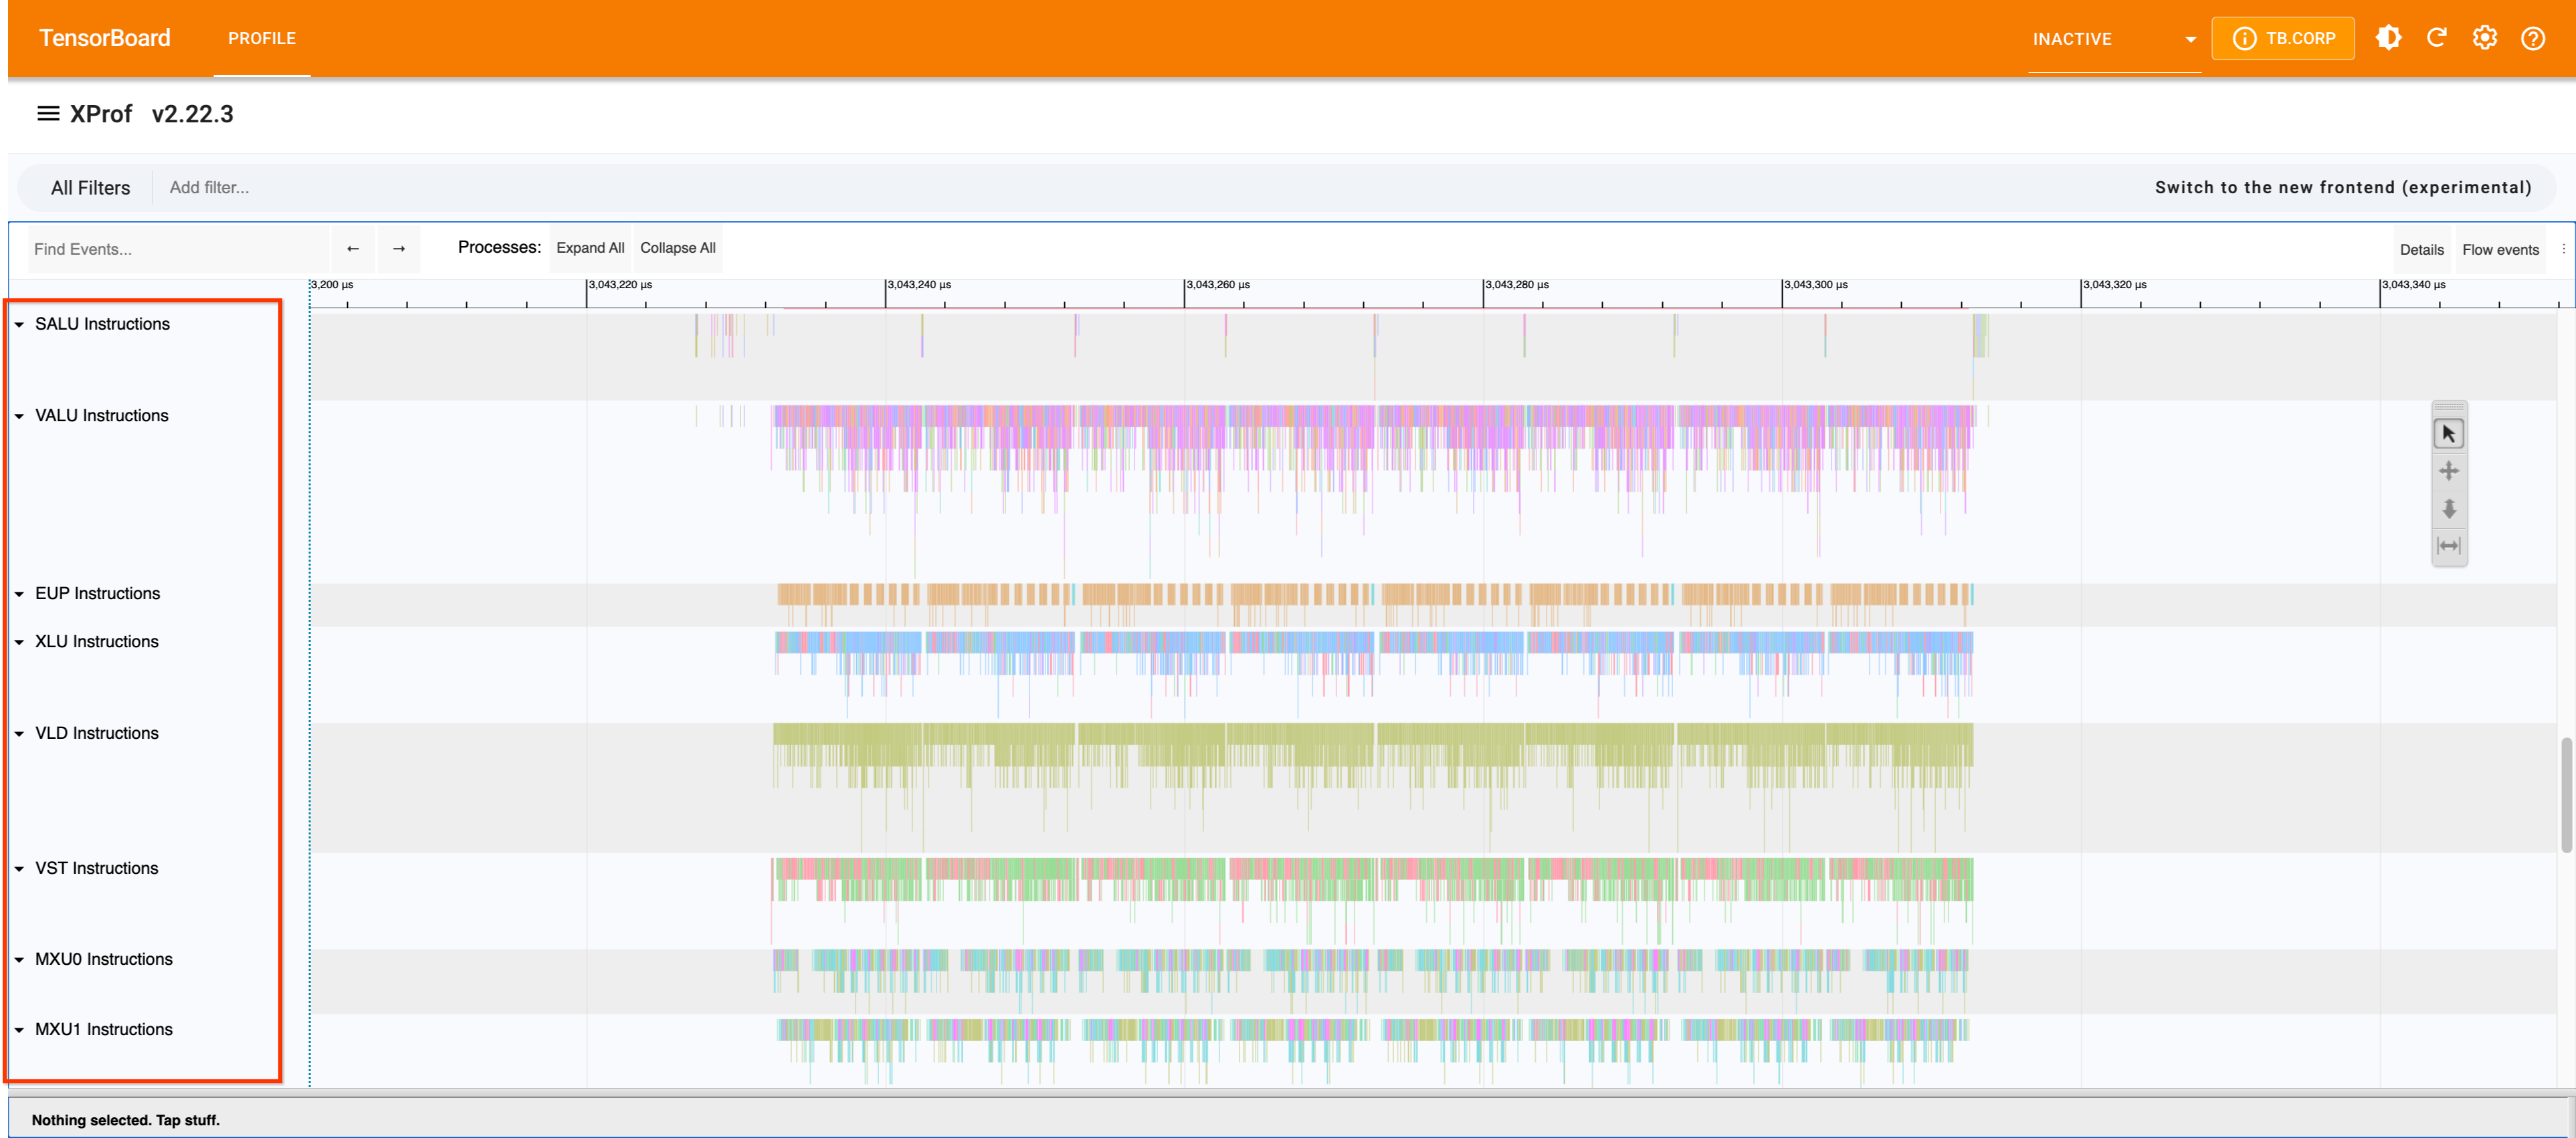
Example Trace Viewer
Here is an example of what the LLO traces look like in the Xprof Trace Viewer:
Advanced Parameters (Handling Event Drops)
If you see event drops or buffer overflows in Xprof, it means the trace points are being triggered too frequently, overwhelming the hardware trace buffers. You can tune the frequency of LLO trace insertion using advanced parameters.
These parameters are configured via xla_tpu_bundle_instrumentation_options.
You can control how often traces are packed into instruction bundles.
Key Parameters
trace_best_effort_frequency(Default: 10): The target interval (in bundles) for inserting opportunistic traces packed into existing bundles. The compiler will try to insert a trace this often but will not create new bundles for it.trace_guaranteed_frequency(Default: 10): The maximum number of bundles allowed between two traces. This is a guarantee. Whenever we cannot satisfy this by packing traces into existing bundles, we will create a new bundle and place a trace there (by itself).
How to Tune
- If you see Event Drops: Increase the values (e.g., set to 50 or 100) to trace less frequently, reducing the volume of trace data generated.
- If you need finer granularity: Decrease the values to trace more frequently (at the cost of higher overhead and potential buffer overflows).
How Instruction Cycle Counts are Calculated
Because trace points are injected opportunistically rather than at every single instruction, intermediate timestamps are interpolated based on estimated hardware cycle costs.
The compiler calculates the intrinsic hardware cycle cost of each LLO instruction based on the target TPU generation and the Execution Unit resolving it. These cycle counts represent execution throughput and latency delays.
High-Level Flow
- Parse LLO Instruction: Identify the Opcode and Metadata.
- Get Base Hardware Cycles: Determine cycles based on TPU Generation (v5e/v5p, v6e/v7x, etc.).
- Convert to GTC Ticks: Translate cycles to Global Timer Counter (GTC)
ticks using formula:
Cycles * (GTC_Freq * 16) / TC_Freq. - Create Timeline Span: Interpolate intermediate events evenly between known trace boundaries.
Cycle Estimates by Unit and Generation
Below are examples of how base hardware cycles are modeled for different execution units:
Matrix Multiply Unit (MXU)
The MXU cycle counts reflect throughput based on data type density.
| Instruction Category | Sub-Type / Format | (v5e/v5p) | (v6e/v7x) |
|---|---|---|---|
| Vector Matmul | F32 | 8 | 8 |
| Matmul Preprocessing (F8 to BF16) | 4 | 4 | |
| Packed BF16 | 2 | 2 | |
| Integer Formats (U8, S8, U4, S4) | 1 | 1 | |
| Vector Latches | Transposed F32 | 4 | 4 |
| Transposed BF16 | 8 | 8 | |
| Non-Transposed F32 | 2 | 2 | |
| Non-Transposed BF16 | 4 | 4 | |
| Matprep / Dwg | All | 1 | 1 |
Transpose Unit (XLU)
Cycle counts represent transpose memory layout and crossbar delays.
| Instruction Category | Sub-Type / Format | (v5e/v5p) | (v6e/v7x) |
|---|---|---|---|
| Packed Transpose | All | 17 | 4 |
| Standard Transpose | B32 Transpose | 9 | 4 |
| B16 Transpose (Segmented/Compressed) | 17 | 4 |
Execution Unit Pool (EUP)
EUP instructions represent vector math functions (e.g., tanh, log, exp).
| Instruction Category | (v5e/v5p) | (v6e/v7x) |
|---|---|---|
Vector Math (tanh, exp, etc.) |
2 | 1 |
Flag Migration & Reconciliation
Earlier versions of XLA and TPU documentation referenced the legacy flag
--xla_enable_custom_call_region_trace=true.
- Canonical Flag:
--xla_xprof_enable_custom_call_tracing(canonical name when runtime intra-kernel bundle timeline spans are wanted; use--xla_xprof_register_llo_debug_info=truealone by default). When enabled, it activates custom call tracing while automatically configuring the required instruction bundle instrumentation and trace frequencies (xla_tpu_bundle_instrumentation_options). - Legacy Flag:
--xla_enable_custom_call_region_trace=true(Deprecated alias). While still supported by older compiler backends, users needing runtime bundle timeline spans should migrate to--xla_xprof_enable_custom_call_tracing.
Default capture example (registers LLO debug info while keeping HLO and kernel stats intact):
export LIBTPU_INIT_ARGS="--xla_xprof_register_llo_debug_info=true"
python your_jax_workload.py
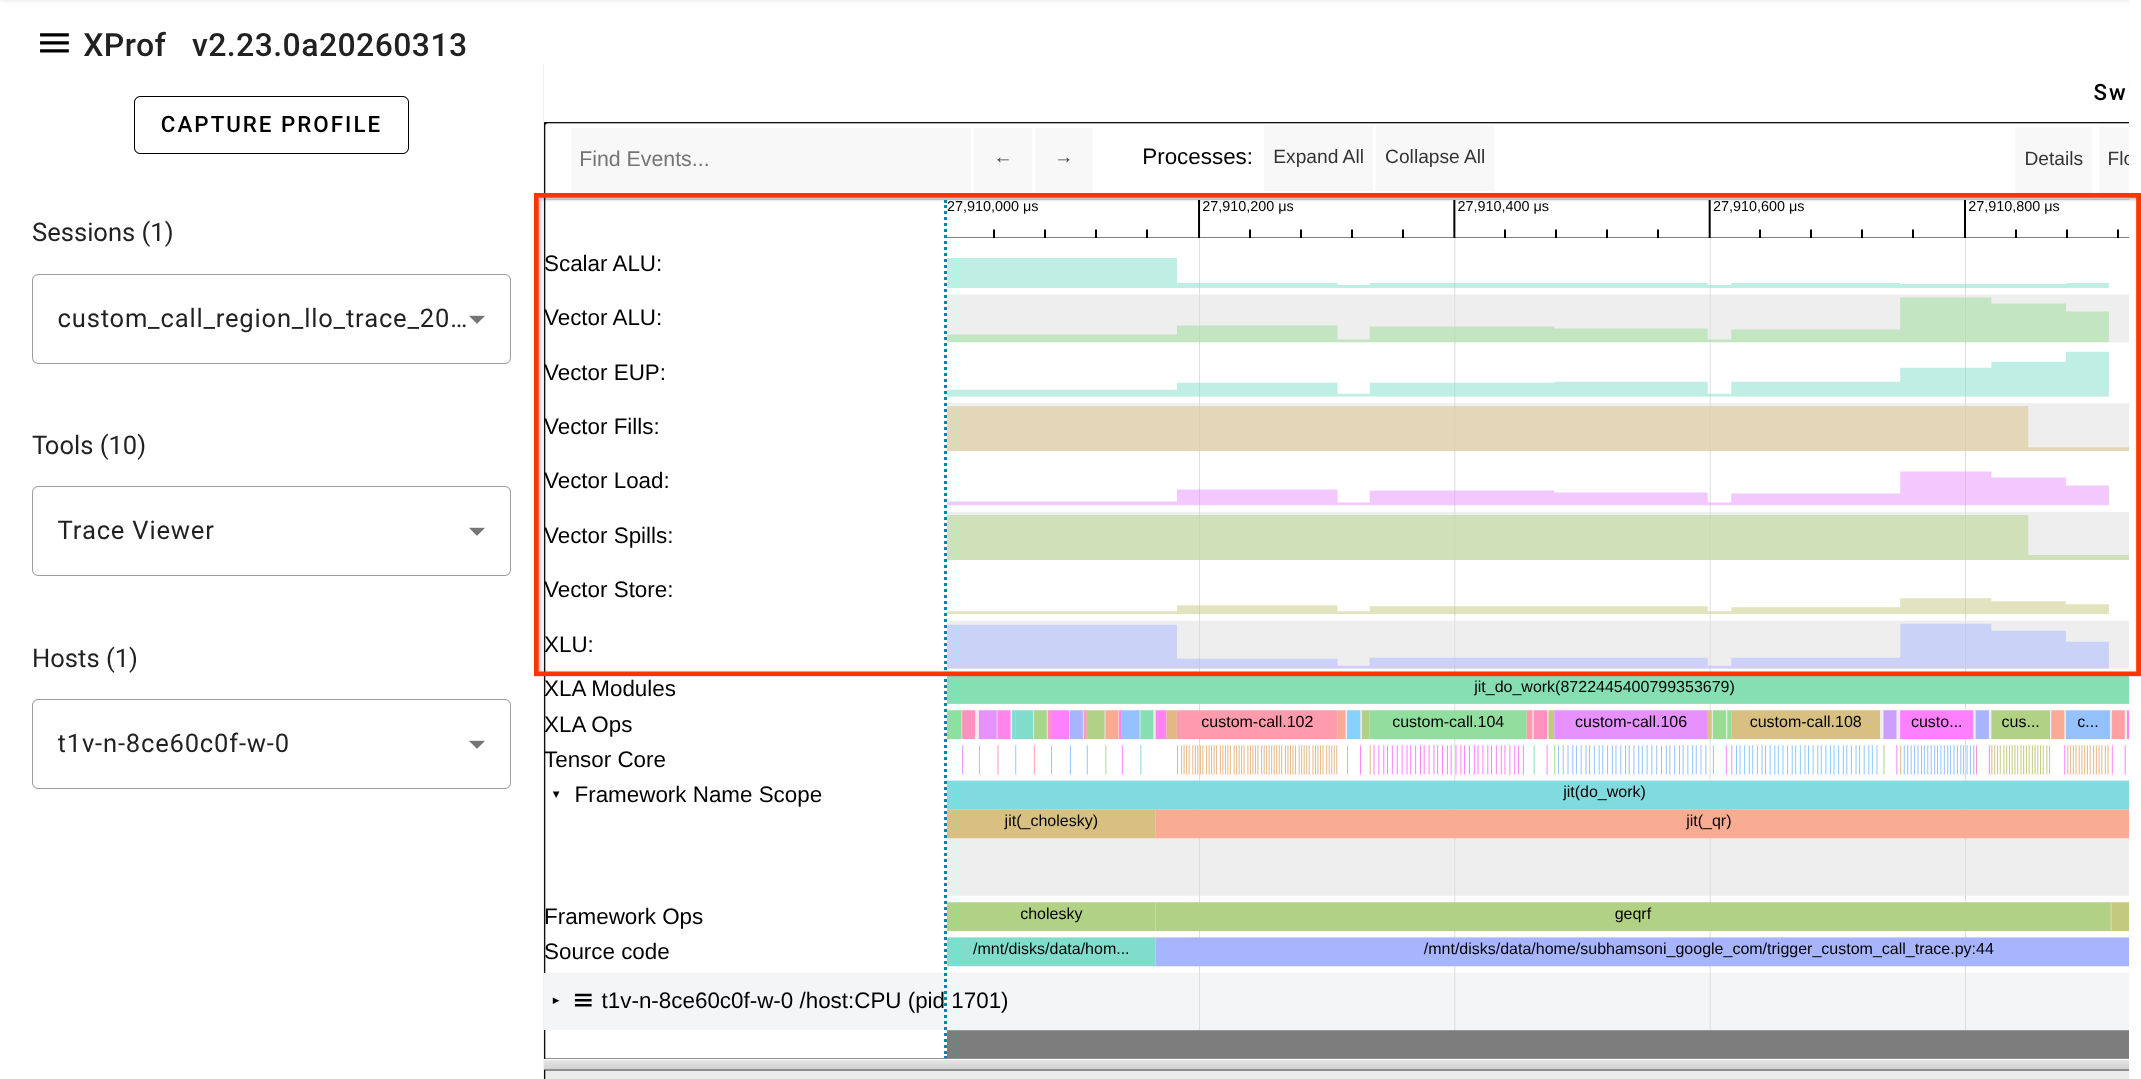
When custom call tracing is enabled alongside LLO debug info, a new LLO utilization line will appear in the Trace Viewer for each TPU core or device executing the custom call.
LLO Utilization Line
The LLO utilization line provides a visualization of how hardware resources are used during the execution of a custom call. This is particularly useful for identifying bottlenecks within custom kernels (e.g., those written in Pallas or Mosaic).
Best Practices & Field Gotchas
- Use
xprof-nightly: Standardxprof2.23.1 lacksget_kernel_statsand LLO CLI subcommands (as well as the standalonexparityconsole script for numerical parity verification). In non-Google3 environments, always installxprof-nightly. - Metrics Interpretation for Pallas Kernels (Roofline Blind Spot):
XLA has no cost model for
tpu_custom_call. Therefore,get_roofline_modelandget_overviewwill report0.0 GFLOP/s,"bound_by": "Unknown", and0.0%MXU utilization even when LLO instructions are fully captured and executing on hardware.- For kernel duration and latency, use
xprof get_kernel_stats <logdir>. - For low-level instruction execution breakdown and cycle estimates, use
xprof get_llo_analysis <logdir>.
- For kernel duration and latency, use
- Lite Proto Inner Loop Bodies: In
get_llo_debug_string, inner loop bodies are summarized as// Loop body not available in lite proto. It provides the surrounding module structure, register allocation, and outer instruction sequence. - Trace Validation Heuristic: Do not check for trace line names like
SALU / VALU / EUP / XLU / VLD / VST / MXU Instructionsto determine if LLO data exists. Valid LLO traces do not use those line names. Validate LLO capture by executingxprof get_llo_analysis <logdir>and verifying"success": true. - Capture Kernel Sizing: Sizing test/capture kernels too large can trigger
compiler errors such as
CompileTimeScopedVmemOom: Scoped allocation with
size 32.81M and limit 32.00M exceeded scoped vmem limit
. Keep capture matrices conservatively sized (e.g.(512, 512, 1024)f32). - Separate Virtual Environments: When porting kernels across JAX
versions (e.g., JAX 0.11+ deprecations such as
pltpu.repeat), maintain dedicated virtual environments.