XProf Kernel is a product suite designed for Pallas Kernel authoring and performance optimization. It enhances visibility and understanding of "custom-calls" runtime performance—areas that typically remain "black boxes" within XProf event tracing.
XProf currently offers features like custom call profiling, which traces static TPU bundles to link Low-level Optimizer (LLO) instructions back to traced events. While this provides lightweight tracing, it lacks visibility into the detailed runtime behavior of various TPU components. XProf Kernel fills this gap by enabling the profiling of fine-grained runtime performance counters. This guide explains how to trigger, collect, and visualize these counters in a time-series format within the Trace Viewer.
Enabling Fine-Grained Performance Counters
Enable performance counters through the Advanced Configuration Options in your JAX Profiler TPU options, as shown in the example below:
options = jax.profiler.ProfileOptions()
options.advanced_configuration = {
    "tpu_enable_periodic_counter_sampling" : True,
    "tpu_tc_perf_counter_sampling_options" : (
        'interval_us:1 scaling:0 counter_size_bits:1 indices:10 indices:11 indices:56 indices:57 indices:58'
    ),
}
tpu_enable_periodic_counter_sampling: Set this flag to signal that fine-grained performance counters should be collected.tpu_<component>_perf_counter_sampling_options: Use these flags to configure sampling parameters and specify which counter indices to profile for a specific component (components are listed in the Determining Counter Indices section). Supported settings are detailed in the table below; settings not explicitly defined will use their default values.
| Field | Description | Default |
|---|---|---|
interval_us |
The frequency of counter collection in microseconds (us). The minimum interval is 1 us. | 10000 us |
scaling |
The number of bits to right-shift when collecting counter values. Use this if least significant bits (LSBs) are unnecessary for your analysis. Scaling helps reduce payload size and prevents trace drops, while Trace Viewer will automatically restore the original values for display. | 0 |
counter_size_bits |
The bit-width of counters in the packed payload. Valid values (n) range from 0 to 3, corresponding to a size of 2^(n+3) bits: 0=8 bits, 1=16 bits, 2=32 bits, and 3=64 bits. |
3 (64 bits) |
indices |
The specific counter indices to profile. These are determined using the perf counters tool (see instructions below). | none |
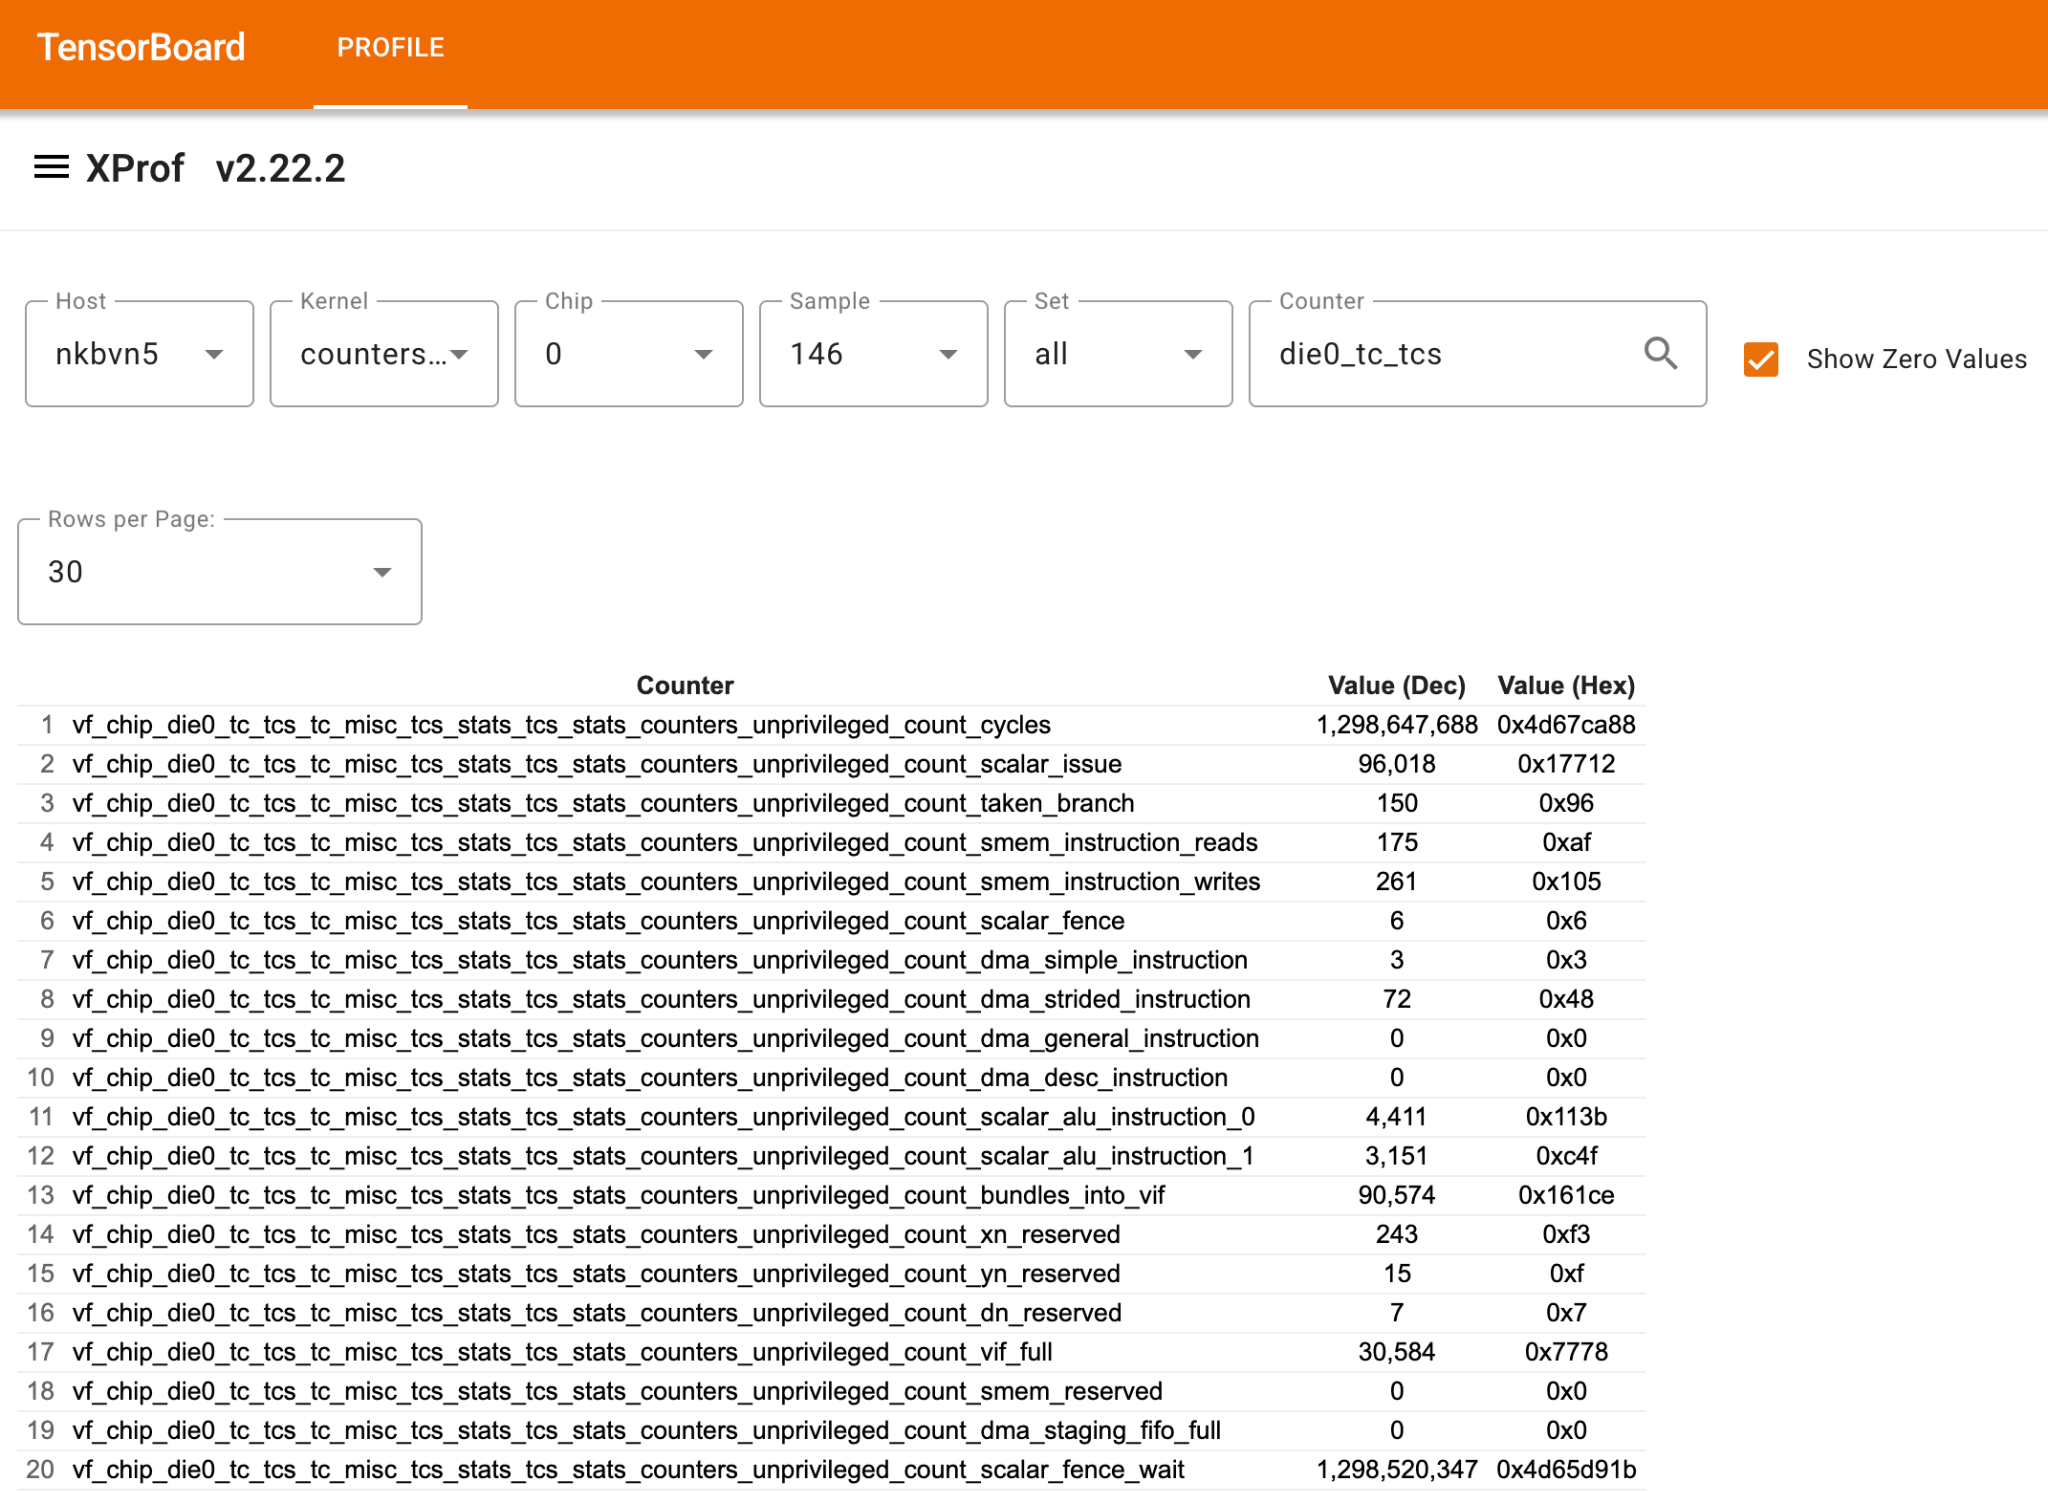
Determining Counter Indices
Use the Perf Counters tool to identify the specific indices for the component you wish to profile. Follow these steps:
- Navigate to perf counters in any TensorBoard trace supporting perf counters.
- Enable "Show Zero Values" to get a complete list of counters profiled.
- Search for your target component. Use the bolded keywords from the table below as search queries to locate the correct counters:
| Component | Keyword |
|---|---|
| TC | vf_chip_die0_tc_tcs_tc_misc_tcs_stats_tcs_stats_counters |
| SCS | vf_chip_die0_sc_0_scs_sc_stats_counters |
| SCTD | vf_chip_die0_sc_0_sctd_0_sc_stats_counters |
| SCTC | vf_chip_die0_sc_0_sctc_0_sc_stats_counters |
| CMN | vf_chip_die0_cmn_cmnur_0_cmn_stats_debug_fixed_stats_counters |
| ICR | vf_chip_chiplet_icr_icr_data_0_debug_domain_icr_data_stats_packet_counters |
Identify your counter in the resulting table. Calculate the index as (row index - 1). Below is an example of the perf counters tool and the corresponding TC counters.
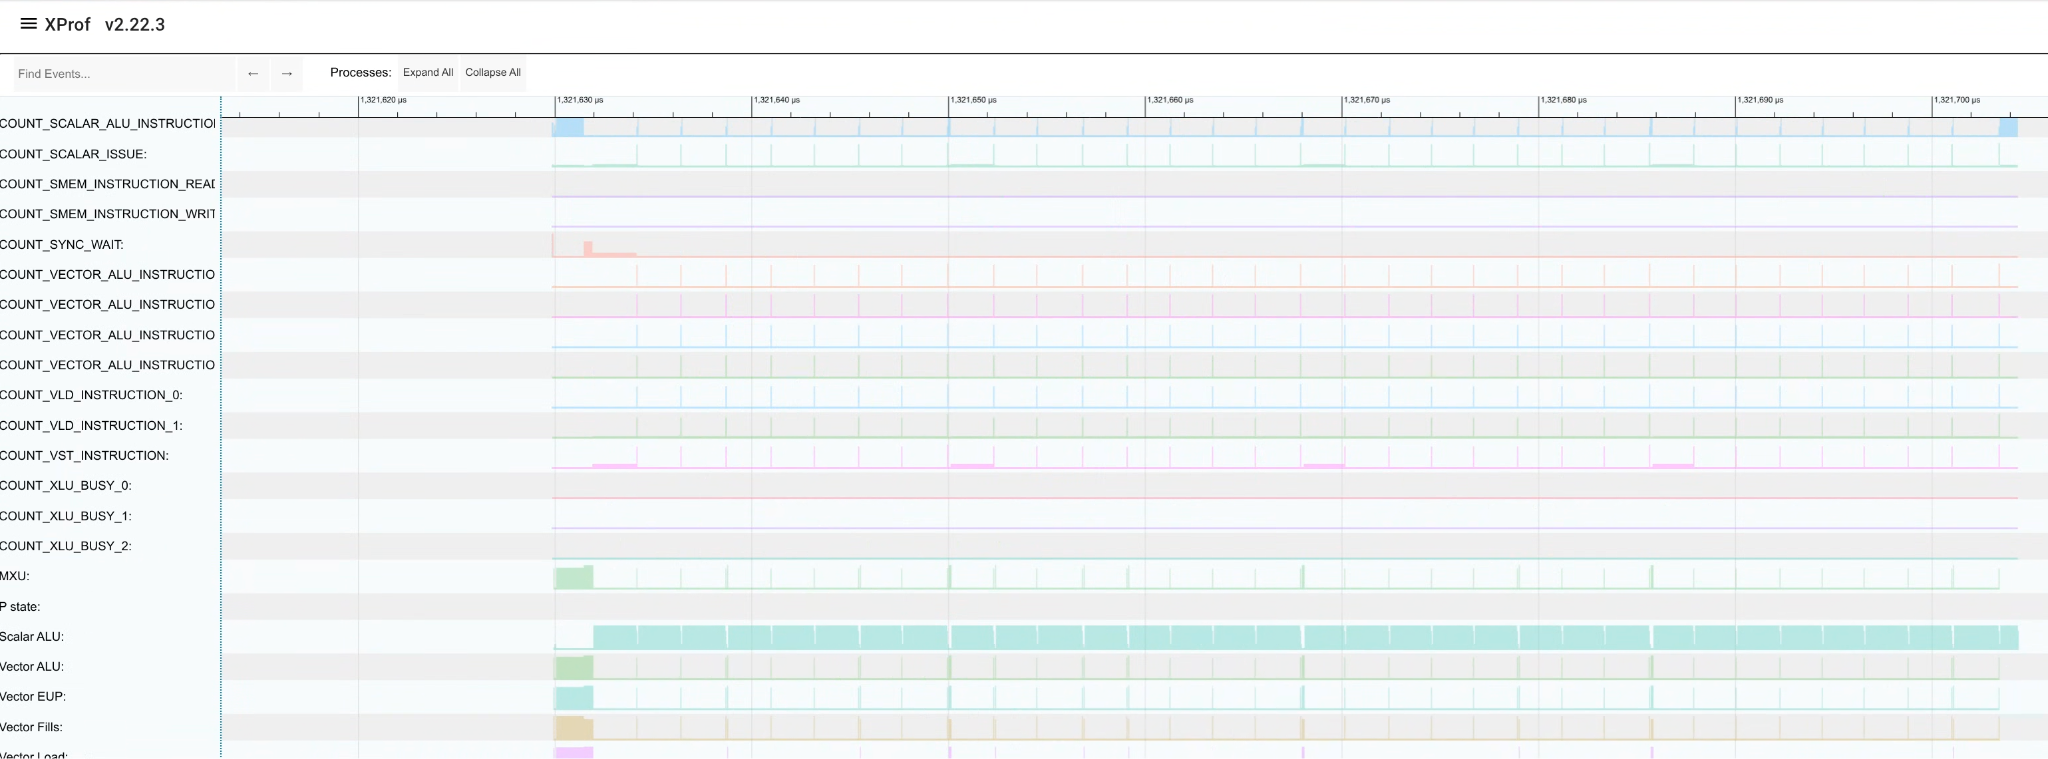
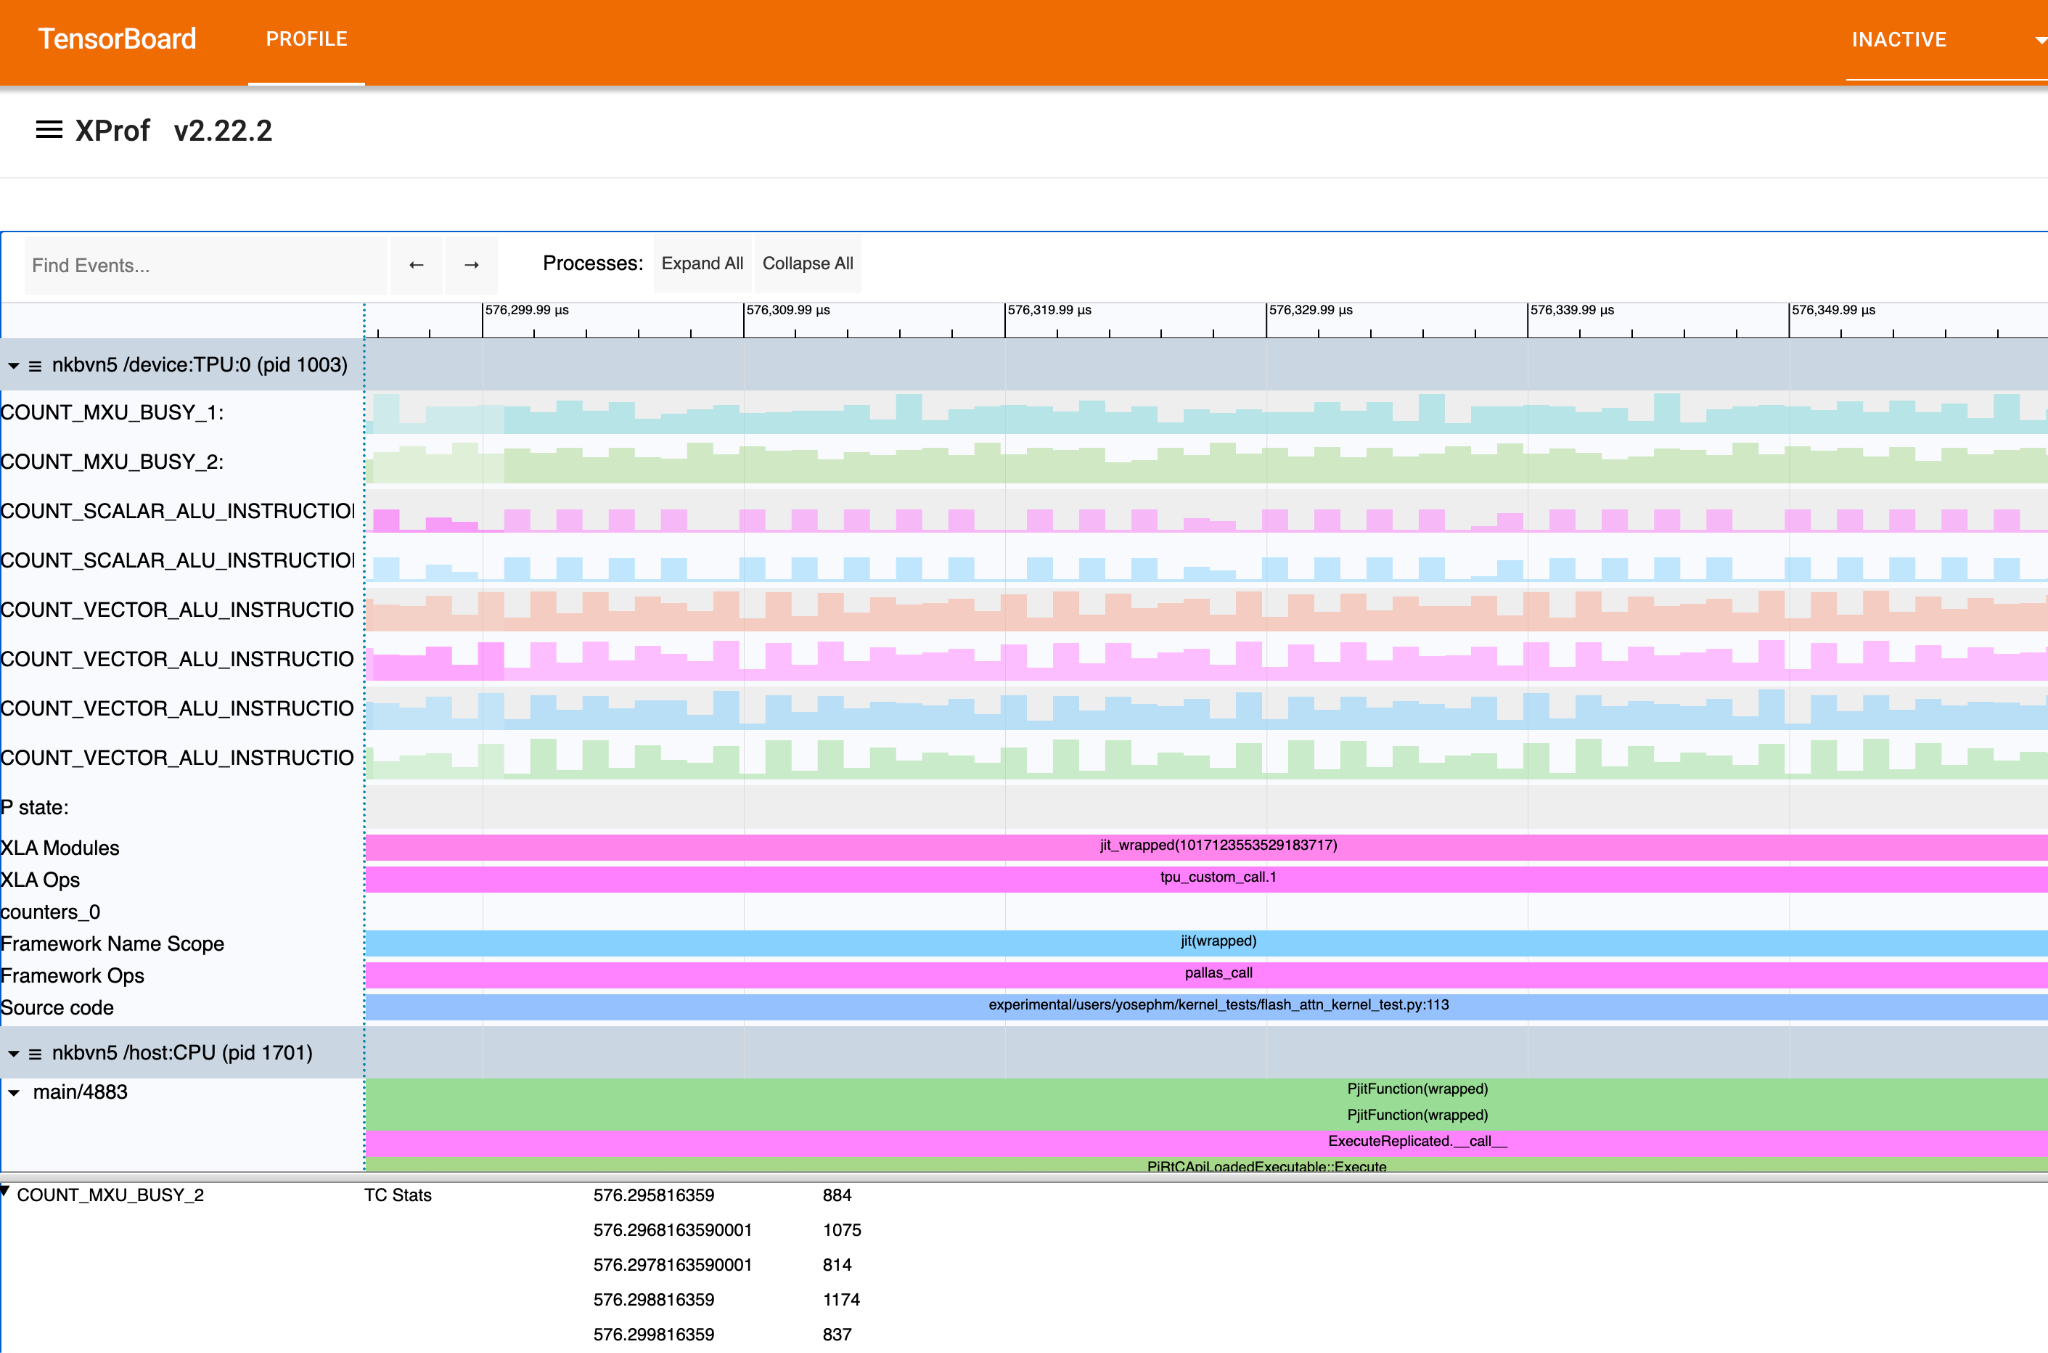
Visualizing Runtime Counters
In the Trace Viewer, collected counters appear as lines, based on the specified indices and frequency. Selecting counter points opens a bottom modal displaying its value, including the increment since the last data point and its corresponding timestamp.
Advanced: Event-Triggered Counter Sampling
In addition to periodic performance counter collection, you can configure counters to sample based on external events, such as the execution of custom calls or specific TPU instructions.
This event-driven approach provides sub-microsecond capture latency and highly precise attribution. By comparing runtime performance against static execution models, you can more effectively identify bottlenecks down to the bundle or instruction level.
To enable event-triggered collection, replace the interval_us parameter
with is_external_trigger:true in your configuration. Example:
options = jax.profiler.ProfileOptions()

# Example request for externally triggered collection
options.advanced_configuration = {
    "tpu_enable_periodic_counter_sampling": True,
    "tpu_tc_perf_counter_sampling_options": (
        "is_external_trigger:true scaling:0 counter_size_bits:1 indices:10 indices:11 indices:56 indices:57 indices:58"
    ),
}