This guide describes how to use XProf tools to track tensor lifetimes and identify tensors or buffers that are not being freed correctly, which can lead to memory leaks or out-of-memory (OOM) errors.
Overview
XProf provides several complementary tools for analyzing memory allocation and deallocation patterns:
- Memory Profile: Dynamic runtime view of memory allocations and deallocations over time, including a Memory Breakdown Table;
- Memory Viewer: Static, compiler-based view of buffer allocations in program order;
- Trace Viewer: Timeline visualization showing operation execution and dependencies.
Start by capturing your profile.
Analyze Memory Timeline With Memory Profile
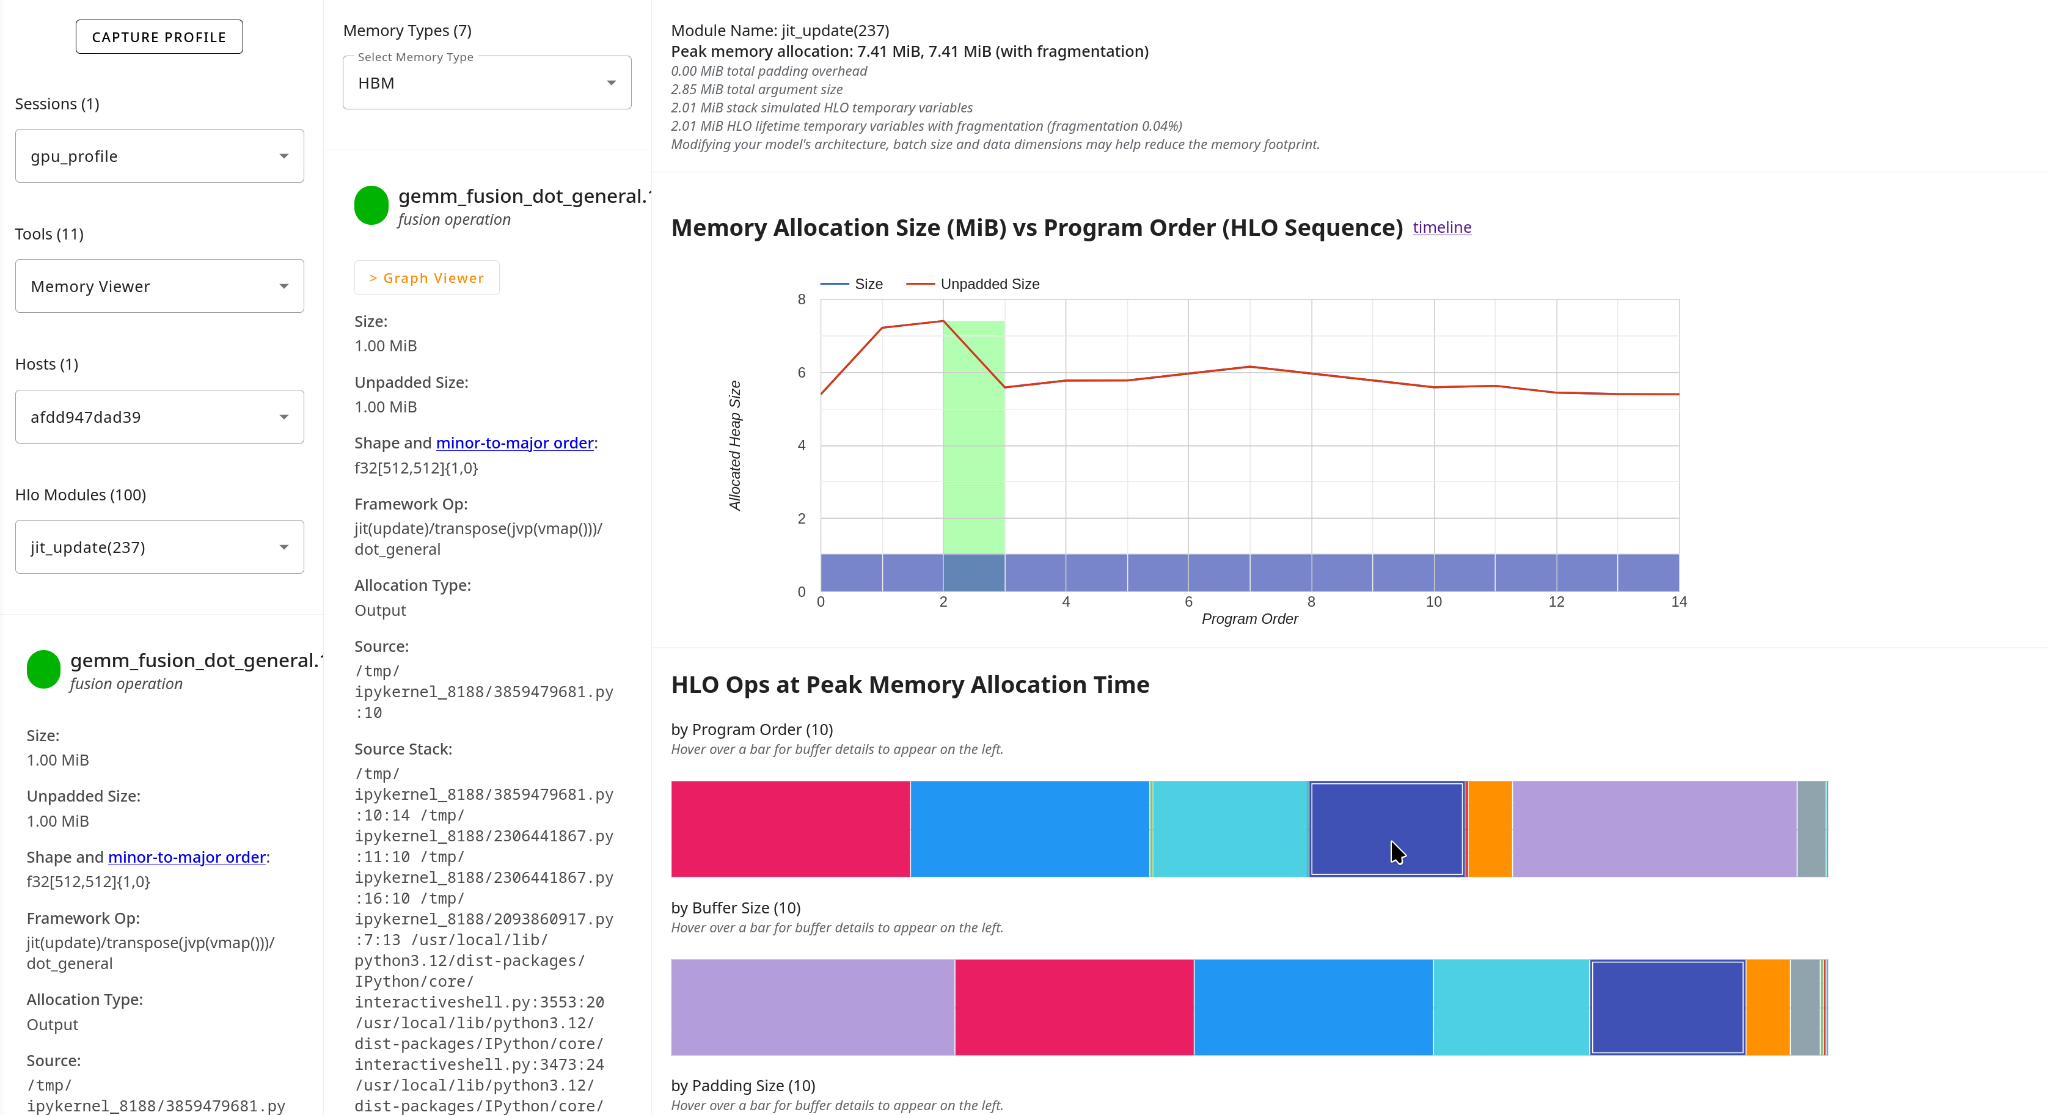
Open the Memory Profile tool to get a dynamic view of allocations and deallocations. Make sure you choose the appropriate Memory ID (usually HBM for GPU/TPU).
Examine the Memory Timeline Graph:
- Increasing memory usage: Look for upward trends in heap usage (orange) that never decrease, as they may indicate memory leaks.
- Missing deallocations: If memory grows continuously across steps, deallocations may not be happening.
- Fragmentation spikes: High fragmentation can indicate inefficient memory management. Check Diagnosing Fragmentation for more information.
Check the Memory Profile Summary: The total number of allocations vs. deallocations should be roughly balanced. If the number of allocations is higher than the number of deallocations during the profiling window, tensors are accumulating in memory.
The Memory Breakdown Table, at the bottom of the Memory Profile tool interface, shows which framework operations contribute most to memory usage at peak, and can also be used to identify OOM errors or memory leaks.
Track Individual Buffer Lifetimes With Memory Viewer
Use Memory Viewer for a detailed static analysis of buffer lifetimes.
- Choose the Memory Viewer tool and select the HLO module you want to analyze from the dropdown.
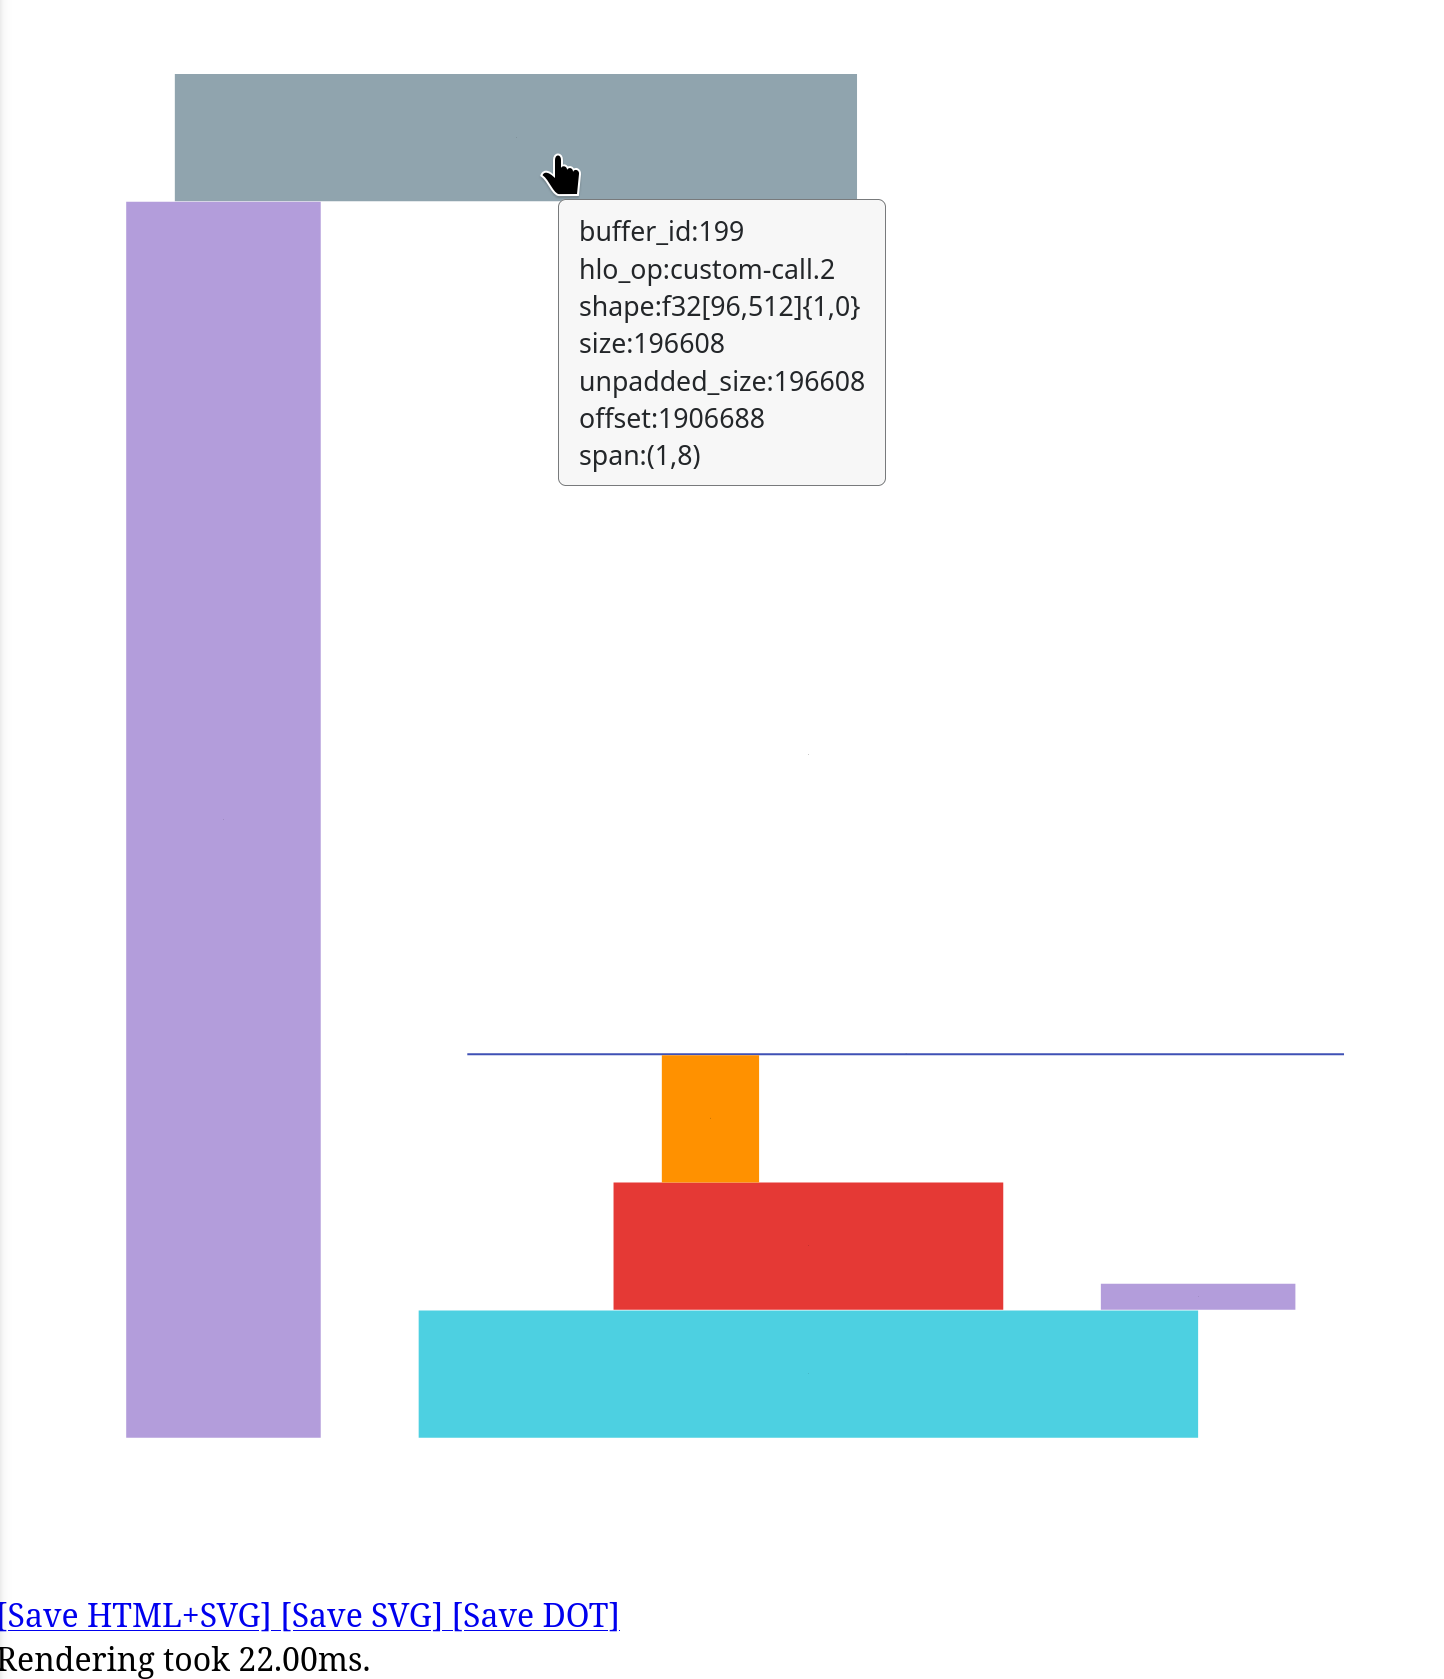
Examine the Memory Allocation Timeline: click the "timeline" link next to "Memory Allocation Size (MiB) vs Program Order (HLO Sequence)". This will bring up a visualization of the memory allocations, with a series of colored boxes, one per allocation.
- Each colored block represents one allocation;
- The width of each block represents the lifetime in program order;
- The height of each block represents the size of the allocation;
- The vertical placement of each block represents its starting memory address (offset).
Look for blocks that span the entire program, which means they were never deallocated. You can hover over the blocks for more information about the HLO operation being represented.
Inspect the Buffer Charts on the Memory Viewer tool to Identify long-lived allocations. After selecting the HLO Module you want to inspect, navigate to the “HLO Ops at Peak Memory Allocation Time” section of the tool. Hover over individual buffers in the buffer charts to see more information about the operation represented. If available, the overlay on the line chart shows allocation and deallocation points. Buffers that never deallocate will have bars extending to the end.