
All accelerators (TPUs and GPUs) provide HW performance counters, and the Perf Counters tool displays HW performance counters collected during a profiling session in a tabular form. It can be used to filter and search for counters that are interesting to the user.
How to use the tool
The tool shows a table with 4 columns:
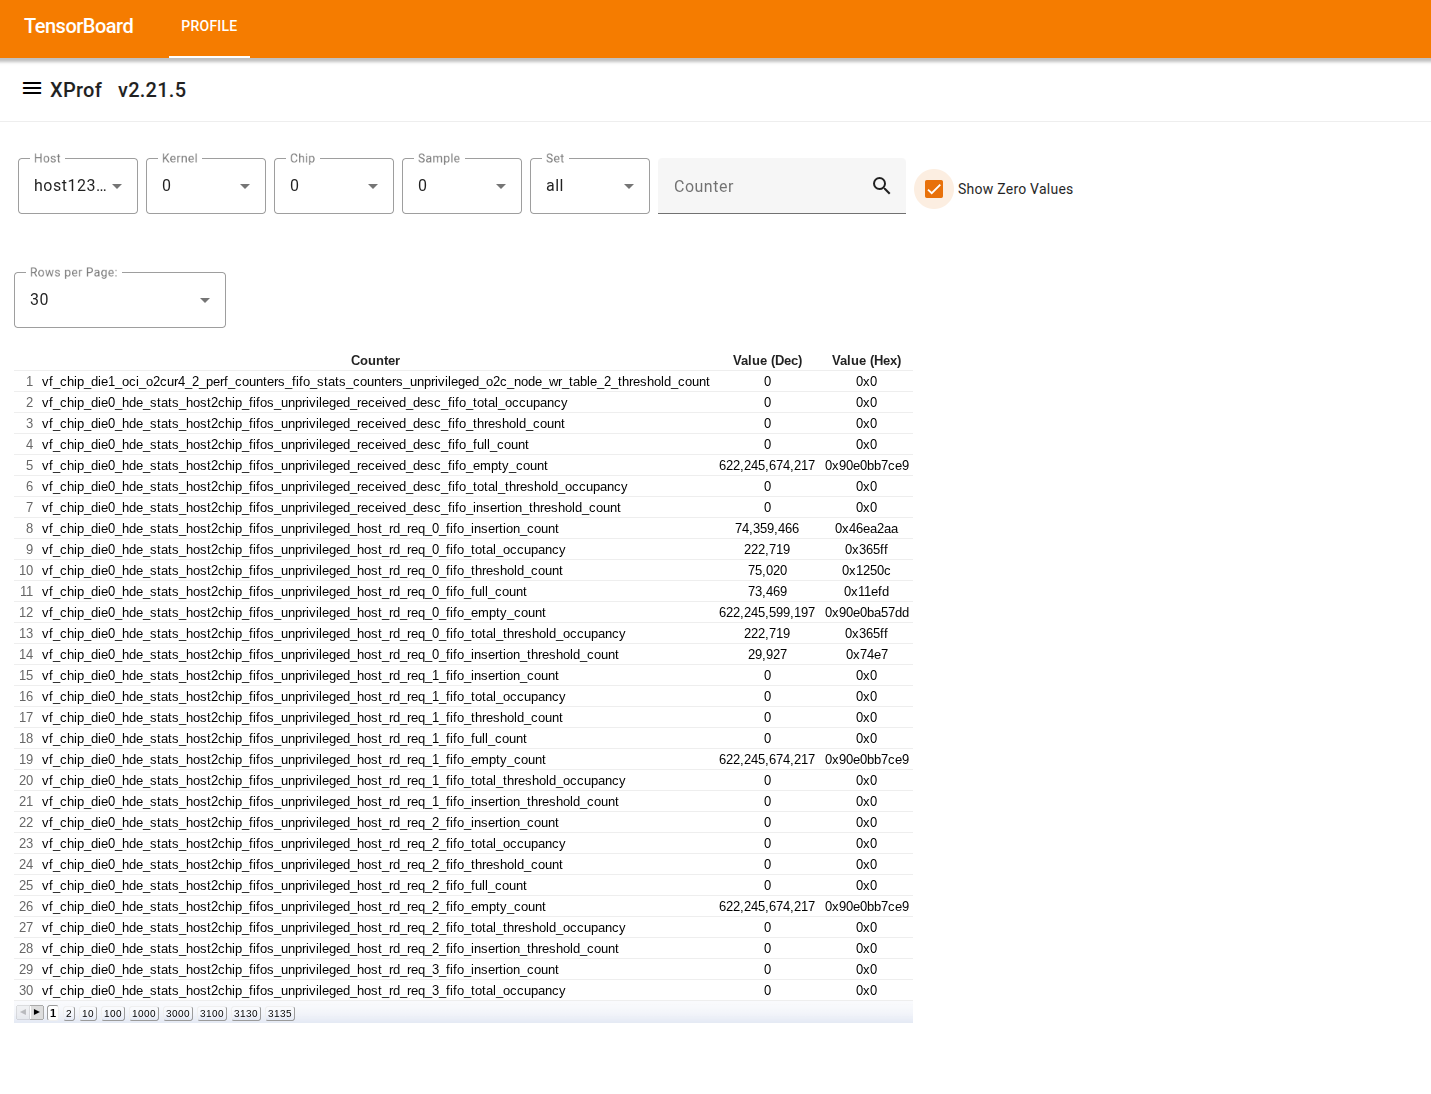
The first column is untitled and shows the row number.
"Counter" shows the counter or metric name.
"Value (Dec)" shows the counter's numeric value in decimal.
"Value (Hex)" shows the counter's numeric value in hexadecimal.
Above the table there are filters that can be used to display only a subset of the rows in the table:
The "Host" filter allows displaying only counters collected on a given host machine.
For TPU programs:
The "Chip" filter allows displaying only counters collected on a given chip.
The "Sample" filter allows selecting which counters sample from the profile should be shown. A profile usually contains a single sample taken at the end of the profiling period, after clearing the counters at the beginning. In some cases a profile might contain multiple samples, e.g., when using "Continuous Performance Counter Profile".
The "Set" filter allows displaying only counters that belong to the selected set, e.g., "issue" selects only the issue counters.
For GPU programs:
The "Kernel" filter allows selecting the name of a GPU kernel computation fingerprint.
The "Device" filter allows displaying only counters collected on a given device (attached to the selected host).
The "Counter" filter has a text box. Typing a string on the text box shows only rows where the counter name contains the input string as a substring.
By default, the tool displays only non-zero counters.